Overview
Ethereum has had a brutal 2026. From a peak near $4,954 in August 2025, ETH tumbled more than 60 percent, briefly touching the $1,600 zone in June after nine consecutive months of selling pressure. ETF outflows, a tighter-than-expected Federal Reserve, and Ethereum's unusually high correlation with Nasdaq tech stocks all piled on at once. Yet underneath the carnage, something unusual is happening: staking ETFs have started paying real yield, validator queues have exploded to multi-year highs, and on-chain accumulation wallets keep adding ETH even as the price falls. This article walks through both sides of the argument so you can decide whether the current drawdown looks more like capitulation or like a genuine entry point.
Key Takeaways
ETH broke below the $2,000 psychological level in early June 2026 and tested support near $1,600, a more than 60 percent drawdown from its August 2025 all-time high.
The selloff is not ETH-specific. It is tied to a broader risk-off move triggered by an AI-stock pullback on Wall Street, a Fed that signaled only one rate cut for all of 2026, and Bitcoin's own correction dragging the entire altcoin market lower.
ETH's correlation with the Nasdaq 100 sits at roughly 0.78, well above Bitcoin's 0.55, which explains why Ethereum tends to fall harder than BTC during tech-stock selloffs.
Staking ETFs from Grayscale and BlackRock have begun distributing real staking rewards to shareholders, and the validator entry queue surged past 3.5 million ETH by late May, signaling sustained institutional interest.
On-chain data shows exchange balances declining and accumulation wallets adding ETH even as price falls, a divergence pattern that historically preceded the rally toward $4,950 in late 2024 and early 2025.
Key downside levels to watch are $1,600 and $1,500. A confirmed close above $1,700 to $1,750 would be the first technical sign of stabilization.
Why Ethereum Crashed This Hard
This drop did not have a single trigger. According to
Altrady's trader guide, Barron's reported on June 10 that Bitcoin, Ethereum, Solana, and XRP all fell together as an AI-related stock selloff weighed on risk assets broadly, with Nasdaq 100 futures sliding in the same window. ETH was not falling in isolation; it was part of a wider reset across risk assets.
The macro backdrop made things worse. The Fed projected only one rate cut for all of 2026, far fewer than the three cuts markets had priced in, and that gap between expectation and reality hit speculative assets hardest. Research from
IG UK shows that Ethereum's correlation to the Nasdaq 100 sits at 0.78 versus Bitcoin's 0.55, meaning ETH is structurally more exposed to swings in risk appetite. The same analysis points to five structural factors behind ETH's underperformance this year: that higher Nasdaq correlation, a 17-day streak of spot ETH ETF outflows totaling roughly $708 million, the absence of a corporate treasury buying floor comparable to Strategy's 845,000-plus BTC position, Layer 2 fee cannibalization eating into Ethereum's value capture, and the Glamsterdam upgrade slipping from June into Q3 2026.
A deeper dive from
KuCoin's market meltdown report traces part of the pressure back to a 15 percent global tariff announcement in February, which stoked stagflation fears and pushed Treasury yields to multi-year highs, draining capital from non-yielding assets like ETH. The report also notes something unusual for this cycle: spot Ethereum ETFs, which normally provide a buying floor during retail panics, instead recorded a ten-day streak of roughly $1 billion in net outflows, with institutional risk managers exiting positions rather than buying the dip.
Where ETH Stands Right Now
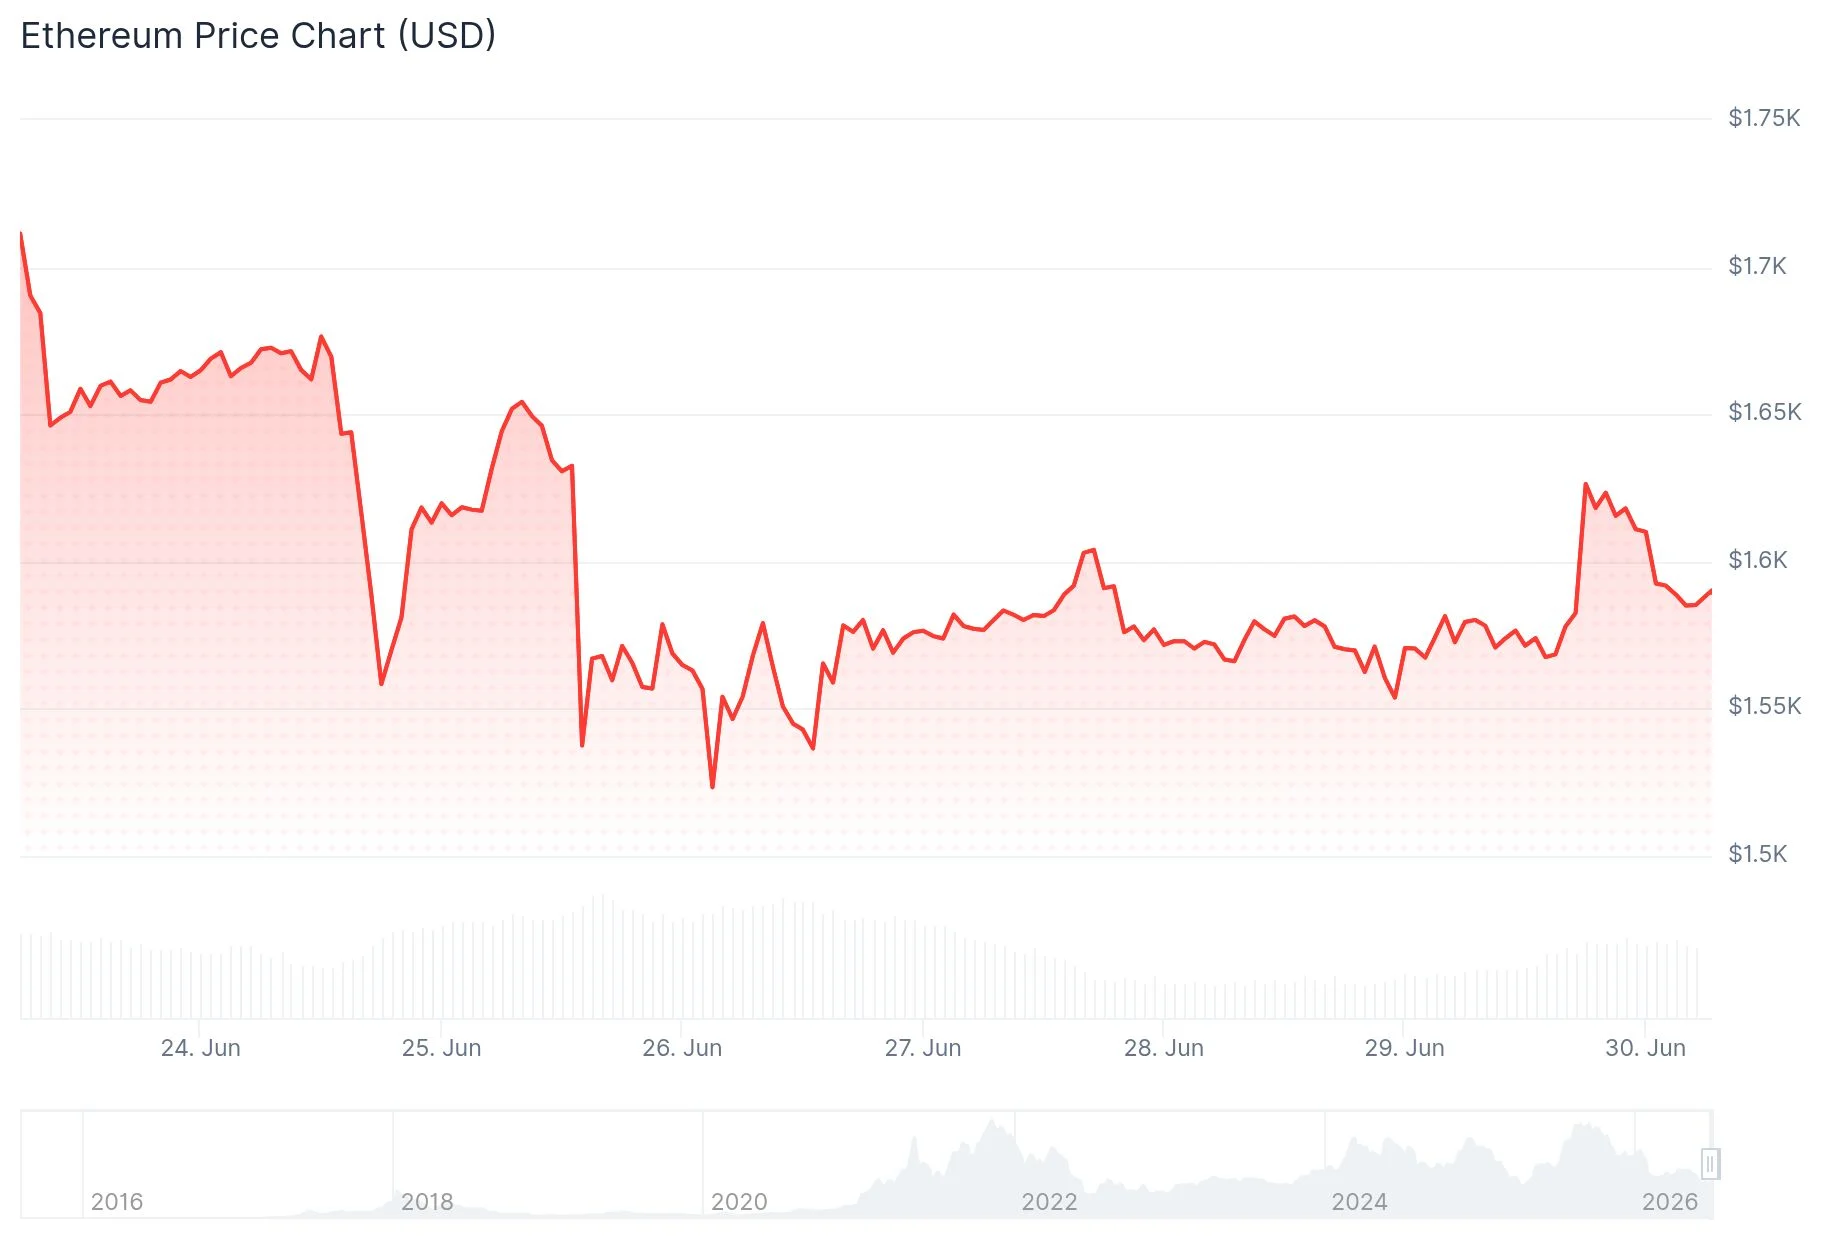
As of mid-June,
Cryptopolitan's price tracker shows ETH testing the $1,600 zone repeatedly, the same horizontal support that marked February's panic lows. Daily candles remain bearish, with lower highs since April, and a confirmed close above $1,700 is needed before any recovery attempt can be taken seriously. Without that reclaim, $1,500 stays the next major downside target.
Institutional forecasts diverge sharply at this stage. According to
analysis from Investing.com, some traders treat the $2,200 to $2,350 zone as a buy area with a stop below the March 14 low of $2,062, targeting $2,500 to $2,584 in the near term and $2,700 to $2,800 if the Fed signals any dovish shift. A longer-range fractal-based target of $6,300 requires roughly a 12-month window combining a Fed rate-cut cycle, sustained ETF inflows, record staking levels, and continued on-chain accumulation. Standard Chartered, meanwhile, has already cut its year-end target from $7,500 to $4,000, reflecting a more cautious institutional read on the pace of any recovery.
If you are weighing whether to step in here, getting comfortable with live order book depth and execution on a platform like
MEXC before sizing a position is a more useful starting point than trying to call the exact bottom.
What Could Support a Recovery
Despite the grim chart, several structural data points are worth tracking.
First, staking demand is accelerating fast. Per
KuCoin's staking research, the validator entry queue went from near zero in January to over 3.5 million ETH by late May, with a wait time exceeding 62 days. Total staked ETH has climbed to roughly 38.9 million coins, about 32 percent of circulating supply. That kind of sustained supply lockup has historically preceded price stabilization or recovery.
Second, staking ETFs are now paying real yield.
BlockEden's coverage notes that Grayscale distributed $9.4 million in staking rewards to ETF investors in January, the first time a U.S.-listed crypto ETF passed on-chain staking income through to shareholders. BlackRock followed with its own staking product, ETHB, signaling that institutional allocators are starting to treat ETH as a yield-bearing asset rather than pure price exposure.
Third, large holders are accumulating.
Investing.com's on-chain data shows a 30 percent increase in ETH held in accumulation wallets since the start of 2026, alongside declining exchange balances. Active addresses and transaction counts have not collapsed in tandem with price, a divergence pattern that previously showed up just before the rally toward $4,950 in late 2024 and early 2025. That precedent does not guarantee a repeat, but it is a signal worth watching closely.
The Risks That Could Make Things Worse
Any honest "is this a good entry" discussion needs to weigh the downside seriously.
Prediction markets are not optimistic in the near term.
IG's analysis notes that as of early June, prediction markets priced a 76 percent chance of ETH touching $1,500 before year-end, suggesting professional traders broadly expect more downside before any sustained turn.
Macro liquidity remains the biggest swing factor. A hawkish Fed signal that walks back priced-in rate cuts could push long-end Treasury yields higher again, and duration-sensitive, non-cash-flow-generating assets like ETH tend to get hit first in that scenario.
Competitive erosion is structural, not cyclical. Solana, Base, and other chains continue pulling developer and user activity away from Ethereum, and Layer 2 fee cannibalization following the Dencun upgrade has weakened mainnet value capture — a slow-moving headwind that won't resolve with a single price bounce.
Finally, staking yield is not a substitute for capital protection. A real-world example reported by
Yahoo Finance shows a $10,000 position in Grayscale's staking ETF falling to roughly $5,328 over six months as ETH's 46 percent year-to-date decline overwhelmed the staking income entirely — a clear reminder that yield alone does not offset a sharp drawdown.
MEXC Crypto Pulse Research Team's Take
Our team's view is that the current setup looks less like a broken asset and more like a deep, sentiment-driven discount layered on top of a genuinely tightening supply structure. The surge in the validator queue, the start of real ETF yield distributions, and continued wallet-level accumulation all point to institutional positioning that has not actually reversed despite the price action. At the same time, ETH's high correlation to U.S. tech stocks, the Glamsterdam delay, and a prediction-market consensus leaning toward $1,500 all argue against assuming the bottom is already in.
Our practical takeaway: rather than trying to time the exact low, scaling into a position gradually across the $1,600 to $1,800 range, with a clearly defined invalidation level around the March 2026 low of $2,062 or a confirmed break below $1,500, is a more defensible approach than going all-in on a single entry. For lower-risk participants, staking-based products offering roughly 2 to 3 percent annualized yield can act as a modest cushion during the holding period, but should not be treated as a primary defense against further price declines. ETH looks cheap right now — but cheap is not the same as a confirmed bottom, and position sizing matters more than perfect timing.
Frequently Asked Questions
What is ETH trading at right now?
As of mid-June 2026, ETH has been trading in the $1,600 to $1,700 range, down more than 60 percent from its August 2025 all-time high near $4,954. Crypto prices move quickly, so always check a live exchange feed for the current figure.
Why did Ethereum crash so much in 2026?
The drop stems from a combination of factors: a broader risk-asset selloff tied to an AI-stock pullback on Wall Street, a Federal Reserve that scaled back expected rate cuts, Ethereum's unusually high 0.78 correlation with the Nasdaq 100, sustained ETF outflows, and continued competitive pressure from rival blockchains like Solana.
Does staking ETH protect me from price drops?
Not fully. Staking ETFs currently distribute roughly 2 to 3 percent in annualized yield, which can partially offset losses but cannot cancel out a sharp price decline. Investors still bear the full risk of ETH's spot price movement regardless of staking participation.
Is dollar-cost averaging into ETH a reasonable strategy right now?
Scaling into a position gradually is a common risk-management approach that reduces the chance of buying entirely at a local high, but it is not financial advice. Whether it suits you depends on your risk tolerance, available capital, and investment horizon, so consider your own circumstances carefully.
How will the Glamsterdam upgrade affect ETH's price?
Glamsterdam was originally targeted for June 2026 but has been confirmed for Q3 2026 instead. The upgrade introduces Verkle Trees and enhanced proposer-builder separation aimed at significantly boosting network throughput, and markets widely view it as a key catalyst for the second half of the year.
Disclaimer
This article is provided for informational purposes only and does not constitute investment, financial, or trading advice. Cryptocurrency markets are highly volatile, and prices can change significantly within short periods. Past performance does not guarantee future results. All prices, data, and forecasts referenced in this article are sourced from third-party public information and may change or contain inaccuracies; readers should independently verify all figures before making decisions. Investing in cryptocurrency carries the risk of loss of principal. Please assess your own financial situation and risk tolerance, and consult a qualified financial advisor where appropriate.
About the Author
The MEXC Crypto Pulse Team is a group of researchers and content creators focused on tracking crypto market trends, macroeconomic shifts, and blockchain technology developments. The team works from primary data, institutional reports, and on-chain indicators to deliver analysis grounded in the market's actual pulse, helping investors navigate a complex and fast-changing landscape with more confidence.
Sources