News Brief
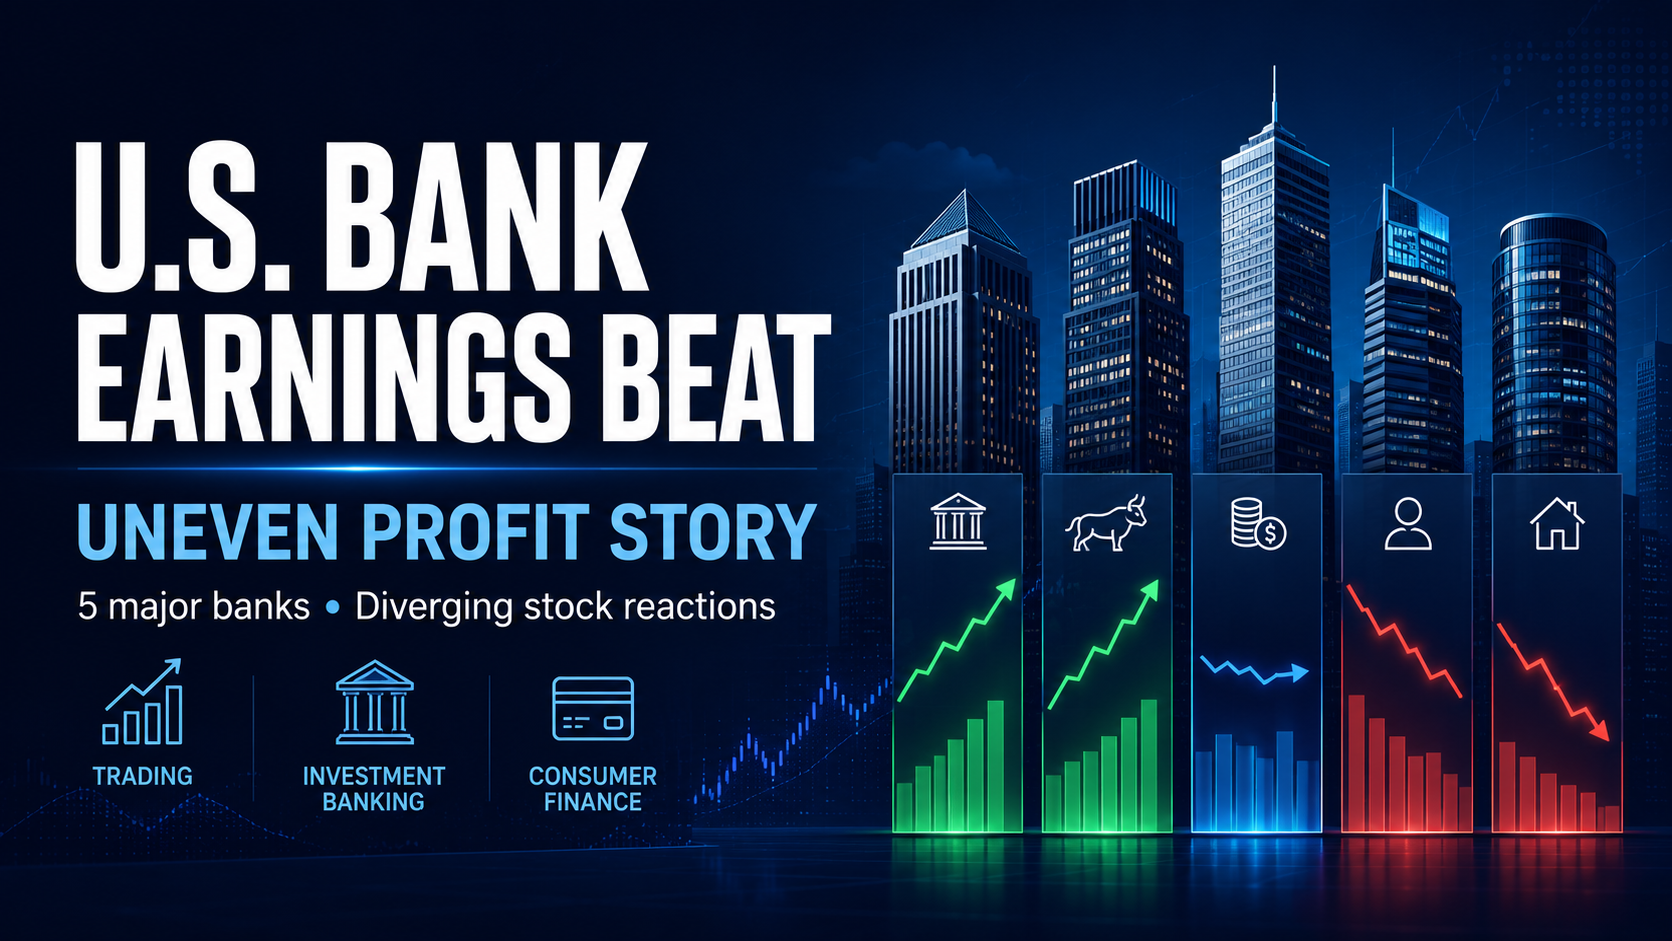
Five major U.S. banks delivered stronger-than-expected second-quarter 2026 earnings, supported by a surge in equity trading, investment-banking fees, underwriting activity, and resilient consumer spending.
JPMorgan Chase, Goldman Sachs, Bank of America, Citigroup, and Wells Fargo generated more than $49 billion in combined quarterly profit, up approximately 39% from a year earlier. Combined revenue increased by more than 20%, with several banks reporting record or near-record trading results.
However, the stock-market reaction was far from uniform. Goldman Sachs shares surged as investors rewarded exceptional growth in trading and investment banking, while Citigroup fell despite beating earnings expectations. JPMorgan and Bank of America also gained, but Wells Fargo lagged. The divergence shows that this was not simply a sector-wide earnings beat. Investors critically analyzed the source of each bank’s growth, the expenses required to generate it, and whether the quarter represented a sustainable improvement or an unusually favorable capital-markets environment.
Trading and Dealmaking: The Common Earnings Engine
The clearest industry-wide signal was the return of Wall Street revenue. Market volatility increased client trading activity, while large IPOs, mergers, equity offerings, and AI-related financing supported underwriting and advisory fees. For several banks, the strongest growth came not from traditional lending, but from equities trading and investment banking.
Bank | Q2 2026 Earnings Signal | Main Growth Driver | Main Investor Question |
JPMorgan Chase | Record headline profit; adjusted earnings beat expectations | Trading and investment banking | Can capital-markets strength offset higher expenses? |
Goldman Sachs | Record quarterly revenue and profit | Equities, financing and advisory | How durable is an exceptionally strong quarter? |
Bank of America | Revenue and EPS exceeded expectations | Record trading and stronger net interest income | Can growth remain broad beyond volatile markets? |
Citigroup | Highest quarterly revenue in a decade | Investment banking, equities and net interest income | Will expenses and execution dilute the improvement? |
Wells Fargo | Profit beat with stronger revenue and loan growth | Trading, lending and improved efficiency | Can it close the returns gap with stronger peers? |
Bank-by-Bank Breakdown
JPMorgan Chase reported $21.2 billion in headline net income, although the figure included a one-time gain connected to its Visa stake. Excluding that benefit, adjusted earnings were approximately $6.14 per share, above market expectations. Markets revenue rose 35%, while investment-banking fees increased 30%.
Read the full JPMorgan Chase Q2 2026 Earnings Press Release for detailed financial disclosures. Goldman Sachs produced the strongest relative result. Net revenue reached a quarterly record of $20.34 billion, while net earnings rose to $6.63 billion. Earnings per share reached $20.98 and annualized return on common equity was 23.5%. The firm’s global banking and markets revenue rose 53%, while equities revenue increased 72%. That performance was materially stronger than the already robust results reported across much of the sector.
View the complete Goldman Sachs Q2 2026 Earnings Results for further metrics. Bank of America reported $31.6 billion in revenue, $9.1 billion in net income, and diluted earnings of $1.21 per share. Net interest income rose 9%, while sales and trading revenue increased approximately 34% to a record level. Equities revenue climbed 70%.
Citigroup generated $24.8 billion in revenue—its highest quarterly figure in roughly a decade—and $5.8 billion in net income, equivalent to $3.15 per share. Investment-banking revenue rose 44%, equities trading increased 45%, and net interest income advanced 13%.
Wells Fargo reported $6.4 billion in net income, or $2.00 per diluted share, compared with $1.60 a year earlier. Revenue rose to $22.6 billion, while provisions for credit losses declined year over year.
The Key Shift in the Earnings Mix
Taken together, the results point to an important shift: the quarter was less a conventional high-interest-rate banking story and more a capital-markets expansion story. Traditional banking remained important—loan balances, card spending, deposits, and net interest income generally held up. However, the largest upside surprises came from activities that benefit from active markets: equities trading, client financing, underwriting, and advisory work.
Goldman’s Rally and Citi’s Decline Show That an Earnings Beat Is Not Enough
All five banks exceeded consensus profit expectations, but investors did not reward them equally. Goldman Sachs rose approximately 7%–8% following the results, while Citigroup fell more than 4%.
Goldman’s global banking and markets revenue increased 53%, supported by 72% growth in equities revenue. Citi’s total markets revenue grew approximately 17%, with equities revenue up 45%—strong in absolute terms, but weaker than the growth reported by several peers.
This comparison illustrates why earnings-season reactions are relative rather than absolute. A bank’s results are judged against:
Wall Street consensus
Expectations already embedded in the share price
The performance of direct competitors
The sustainability of the revenue mix
Expense and capital guidance
Management’s outlook for the next several quarters
Citi delivered a substantial increase in revenue and profit, but investors remained concerned about expenses and the durability of its improving returns. Its return on tangible common equity reached 13%, but management did not raise its longer-term target, contributing to questions about whether the quarter represented a new baseline or a temporary high point.
This is fundamentally different from Goldman, where the scale of the trading and investment-banking upside materially exceeded already elevated expectations. JPMorgan also demonstrated the difference between headline earnings and underlying earnings quality. Its record $21.2 billion profit was partly boosted by a one-time Visa-related gain, and investors had to account for management raising its 2026 expense forecast to $107.5 billion from $105 billion.
Bank of America offered a more balanced earnings mix, reducing its dependence on a single source of upside by pairing record trading revenue with 9% growth in net interest income.
The market’s message was clear: It wasn't about "good" vs. "bad" earnings. It was about which banks converted the favorable environment into the largest, cleanest, and most repeatable earnings improvement.
The Sector Converges on the Same Capital-Markets Cycle
The quarter also revealed a broader strategic convergence among large U.S. banks. Historically, JPMorgan, Bank of America, and Wells Fargo have had larger consumer and commercial banking franchises than Goldman Sachs. Today, each has aggressively expanded its markets, investment-banking, and client-financing capacity.
This strategy is currently paying off. Active equity markets, major listings, mergers, and financing linked to AI infrastructure have created a highly favorable fee environment. Equities revenue soared across the board: JPMorgan (up 86%), Goldman (up 72%), Bank of America (up 70%), Wells Fargo (up 64%), and Citi (up 45%).
However, these revenue streams are highly cyclical.
Trading revenue depends on:
Client activity
Market volatility
Financing balances
Risk appetite
Asset prices
Investment-banking revenue depends on:
IPO issuance
Mergers and acquisitions
Equity and debt underwriting
Corporate confidence
Financing conditions
When conditions are strong, these banks produce exceptional results simultaneously. But if volatility falls, IPO activity slows, or corporate clients delay transactions, this shared earnings engine can weaken quickly. The sector’s stronger profits come with a concentration risk: major institutions are relying on similar, market-sensitive businesses to deliver incremental growth.
Consumer Strength Supported the Quarter, But Capital Markets Stole the Show
The results did not indicate an immediate collapse in U.S. household conditions. Consumer spending remained resilient, deposit levels were generally stable, and credit-card delinquencies showed signs of improvement at several institutions.
While bank earnings can deteriorate rapidly when consumers miss payments or provisions for credit losses rise, the Q2 stock reactions were driven by capital markets, not consumer banking. JPMorgan’s consumer banking income increased only modestly compared to its markets businesses, and Bank of America’s largest surprise was record trading revenue.
The market was pricing two simultaneous signals:
What Investors Should Verify Next
The next quarter will test whether this is the beginning of a durable capital-markets cycle or an unusually strong earnings peak. Keep an eye on these six key metrics:
Investment-Banking Pipelines
Banks reported strong deal pipelines, but announced transactions do not immediately become recognized revenue. Watch whether IPOs, mergers, and underwriting mandates actually close during the second half of 2026.
Trading Revenue Durability
Equities revenue increased between 45% and 86% across the five banks. Future quarters will need to show whether client activity and financing balances can remain elevated against this much higher comparison base.
Expense Growth
Higher revenue-related compensation and technology spending can reduce operating leverage. Scrutinize cost outlooks, just as the market penalized Citi and questioned JPMorgan's raised expense forecasts.
Net Interest Income and Margins
Lower inflation and lower interest-rate expectations can support credit quality and loan demand, but they can also compress the spread banks earn between assets and funding costs.
Credit Quality
Though consumers remained resilient, investors must monitor provisions, charge-offs, credit-card delinquencies, and commercial real-estate exposure. Strong trading revenue can easily mask balance sheet deterioration.
Return on Tangible Common Equity (ROTCE)
ROTCE shows whether banks are producing sufficient profit relative to shareholder capital. Goldman reported an exceptionally strong 23.5% return on common equity, while Citi’s 13% ROTCE left lingering questions about its long-term return profile.
Conclusion
Second-quarter 2026 bank earnings were broadly stronger than expected. Trading, investment banking, and client-financing activity produced major revenue growth, while consumer and credit conditions remained relatively stable.
But the most important signal came from the stock-price divergence. The market was not asking whether the banks made more money—they clearly did. It was asking which banks generated the highest-quality growth, and whether those exceptional capital-markets conditions can persist into the second half of the year.