

STM Stock Price Prediction 2026–2030: Bull, Base and Bear Scenarios

Summary
STM closed near $53.45 on July 27, 2026 after falling sharply following Q2 earnings. The stock had previously reached approximately $81.42 in early June, illustrating the unusually wide range of investor expectations. arios below are illustrative and not analyst consensus estimates.
| Period | Bear case | Base case | Bull case |
| End of 2026 | $40–$48 | $52–$62 | $66–$78 |
| End of 2027 | $38–$52 | $60–$80 | $85–$110 |
| 2030 | $35–$60 | $75–$115 | $125–$180 |
Forecast Methodology
The forecast considers:
- Revenue growth;
- Gross and operating margins;
- Semiconductor-cycle conditions;
- AI data-center revenue;
- Automotive demand;
- SiC adoption;
- STM32 growth;
- Manufacturing utilization;
- Valuation multiples;
- Currency and geopolitical risk.
The ranges are scenario-based rather than precise targets.
End-of-2026 Forecast
Bear Case: $40–$48
This scenario assumes:
- Q3 or Q4 misses guidance;
- Automotive demand remains weak;
- AI optimism cools;
- Unused-capacity charges persist;
- Investors reduce the valuation multiple.
Base Case: $52–$62
This assumes:
- Q3 revenue is near $3.70 billion;
- Q4 revenue exceeds $4 billion;
- Margins improve gradually;
- AI revenue progresses without a major upside surprise;
- The stock stabilizes after the post-earnings decline.
Management’s current outlook supports Q3 revenue of approximately $3.70 billion and Q4 revenue above $4 billion, but these figures remain forward-looking. ull Case: $66–$78**
This assumes:
- AI and satellite programs exceed expectations;
- Automotive orders recover;
- Gross margin expands faster than expected;
- Investors regain confidence in long-term earnings growth.
2027 Forecast
Bear Case: $38–$52
Possible conditions include:
- Data-center revenue falls short of the stated ambition;
- Semiconductor inventories rise again;
- SiC pricing weakens;
- Capital spending fails to produce sufficient returns.
Base Case: $60–$80
This assumes:
- Data-center revenue approaches management’s stated trajectory;
- Automotive and industrial markets normalize;
- MEMS integration succeeds;
- Operating margins continue recovering.
Bull Case: $85–$110
This requires:
- Data-center revenue materially exceeds $2 billion;
- STM32 and power products gain share;
- Factory utilization improves substantially;
- Investors assign a premium multiple to the growth platform.
Management’s “well above $2 billion” data-center ambition for 2027 is conditional on current demand and engagement trends continuing. 30 Forecast**
Bear Case: $35–$60
Possible conditions:
- Automotive and industrial markets remain slow;
- AI infrastructure becomes commoditized;
- SiC returns disappoint;
- Competition limits margins;
- The company remains highly cyclical.
Base Case: $75–$115
This assumes:
- ST maintains leadership in embedded processing, sensors and power products;
- AI data centers become a durable business;
- Manufacturing restructuring improves margins;
- Revenue grows across multiple end markets.
Bull Case: $125–$180
This requires several favorable outcomes:
- Major AI infrastructure growth;
- Strong automotive semiconductor content;
- Successful SiC manufacturing economics;
- Expansion of STM32 and edge AI;
- Higher operating margins;
- Sustained premium valuation.
The upper end is highly uncertain and requires multiple successes.
Factors That Could Raise the Forecast
- AI data-center revenue above management targets;
- Large hyperscaler contracts;
- Faster electric-vehicle recovery;
- Better SiC yields;
- Successful MEMS expansion;
- Strong free-cash-flow growth;
- Higher margins.
Factors That Could Lower the Forecast
- Weak Q3 or Q4 results;
- Slower AI spending;
- Automotive inventory correction;
- Price competition;
- Factory underutilization;
- Currency pressure;
- Acquisition or restructuring problems.
What the Forecast Means for STMON
STMON is designed to track STM-related total-return economics.
However, a STMON forecast must also account for:
- USDT price;
- MEXC order-book depth;
- Token premiums and discounts;
- Ondo operations;
- Blockchain risk.
Eligible users can review STMON/USDT.
FAQ
Could STM return to $80?
Yes under the bull scenario, but a return would require stronger confidence in growth and margins.
Could STM fall below $40?
Yes if the semiconductor recovery weakens or market expectations reset sharply.
Could STM reach $100 in 2027?
It is possible in an optimistic scenario involving strong AI, automotive and margin execution.
Is the STMON forecast identical?
The underlying direction is related, but token-market factors may create differences.
How often should the forecast be updated?
After each earnings report and major AI, automotive, SiC or manufacturing announcement.
Risk Disclaimer
Price forecasts are inherently uncertain. These ranges are analytical scenarios based on information available through July 29, 2026 and do not constitute investment advice.
Description:Crypto Pulse is powered by AI and public sources to bring you the hottest token trends instantly. For expert insights and in-depth analysis, visit MEXC Learn.
The articles shared on this page are sourced from public platforms and are provided for reference only. They do not represent the position or views of MEXC. All rights belong to Sarah Chen. If you believe any content infringes upon the rights of a third party, please contact [email protected] for prompt removal. MEXC does not guarantee the accuracy, completeness, or timeliness of any content and is not responsible for any actions taken based on the information provided. The content does not constitute financial, legal, or other professional advice, nor should it be interpreted as a recommendation or endorsement by MEXC. For expert insights and in-depth analysis, visit MEXC Learn.
Learn More About 4
View More
Are Tokenized Stocks Backed by Real Shares? What MEXC, Kraken, Bybit, and Bitget Actually Hold
MEXC On-chain Daily Report: Major U.S. Banks Plan Shared Tokenized Deposit Network
Best Crypto Exchanges 2026: Top 10 Ranked as 3 Exchanges Shut Down
Latest Updates on 4
View More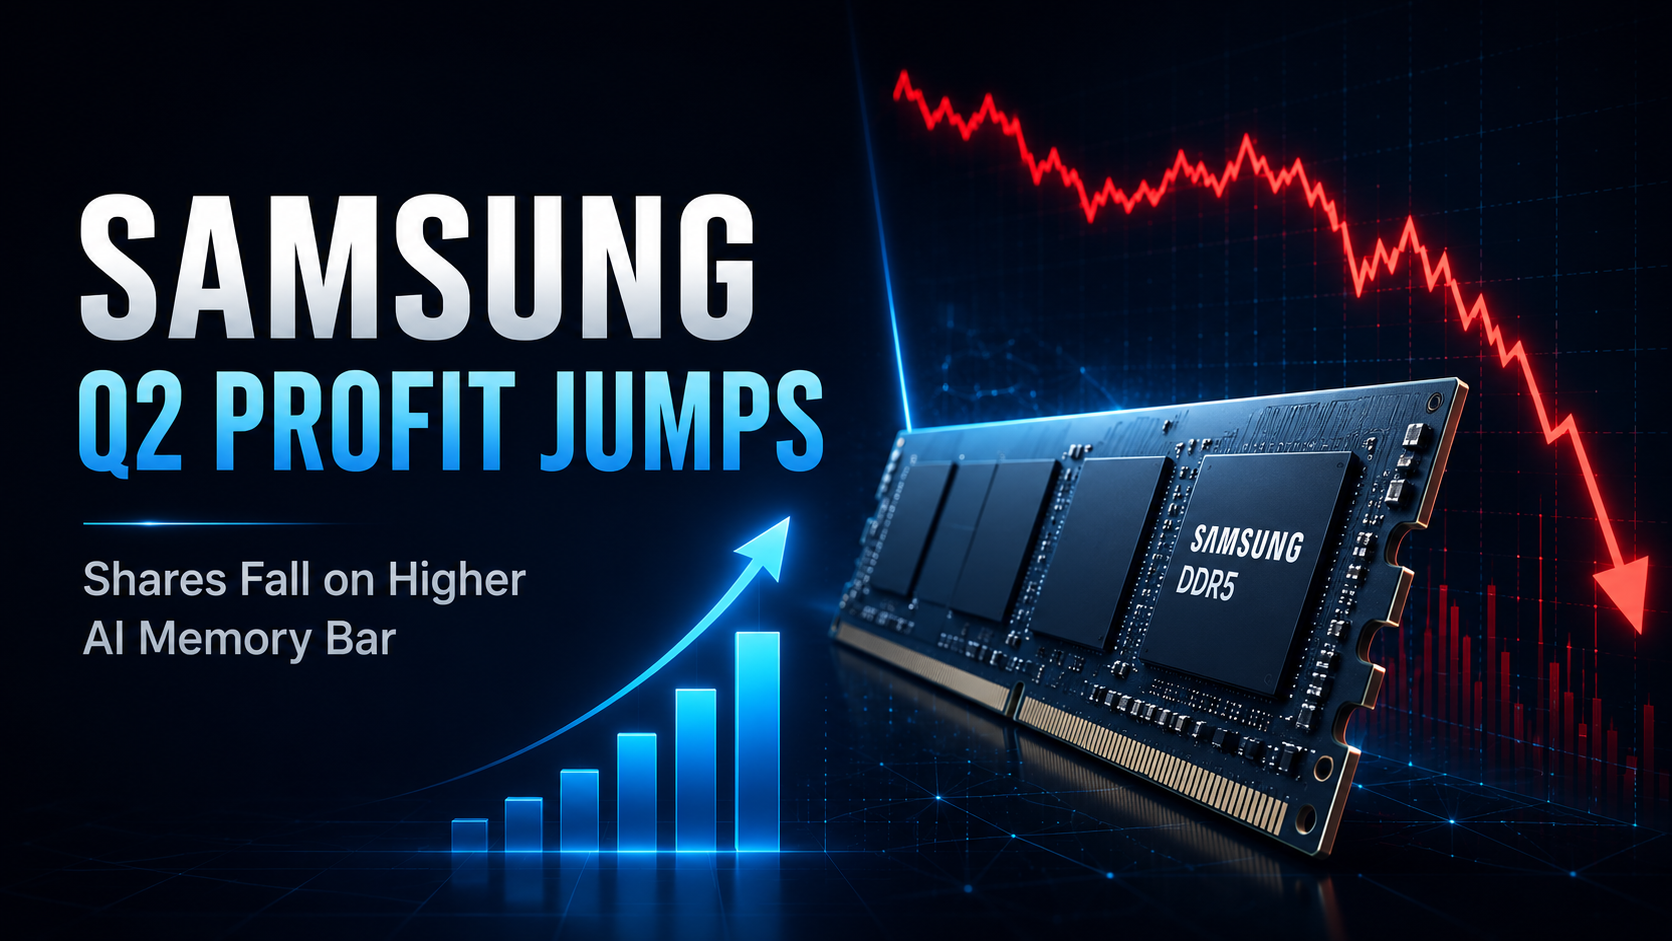
Samsung Q2 Profit Jumps 19x, But Shares Fall: Why AI Memory Stocks Face a Higher Bar

Tesla Q1 2026 Earnings Review: Deliveries Rebounded, But Margin Quality Remains the Real Test

Apple FY2026 Q2 Earnings Review: iPhone Revenue and Services Growth Keep EPS Story Intact


HOT
Currently trending cryptocurrencies that are gaining significant market attention
Crypto Prices
The cryptocurrencies with the highest trading volume
Newly Added
Recently listed cryptocurrencies that are available for trading