Can Solana price break $100 as bullish MACD crossover approaches?
Solana price rallied nearly 8% over the past week but faced resistance at $90 on Thursday. Can the token finally break past the key psychological barrier with a bullish MACD crossover approaching?
- Solana price climbed nearly 9% over the past week but continued to face strong resistance near the $90 level.
- Technical indicators showed improving momentum, with a bullish MACD crossover approaching and Aroon Up signaling strengthening buyer control.
- A breakout above $90 could open the door toward the $97–$100 range, while failure to hold above $85 may trigger a retest of support near $80.
According to data from crypto.news, Solana (SOL) price climbed roughly 9% over the past seven days to trade near $90 on Thursday, pushing its market capitalization above $51 billion. The $90 region has continued to act as a key resistance zone, with previous rallies repeatedly losing momentum around the same level since late March.
However, the daily chart now suggests that momentum may gradually be shifting back in favor of the bulls.
Solana and the broader crypto market have stabilized over the past few sessions as improving geopolitical sentiment and easing oil prices helped restore some investor appetite for risk assets. Bitcoin holding above key psychological levels has also supported renewed confidence across major altcoins.
At the same time, Solana’s recent price action indicates that sellers may be losing control near the upper end of the current range. Unlike earlier rejection attempts, the latest consolidation below resistance has remained relatively tight, suggesting that buyers are continuing to absorb selling pressure rather than exiting positions aggressively.
On-chain activity has also shown signs of stabilization. While trading activity across decentralized applications remains below peak levels seen earlier this year, network participation has stopped deteriorating at the same pace. Futures positioning has also improved modestly, with open interest beginning to recover after weeks of subdued activity.
Solana price analysis
On the daily chart, Solana continues to trade within a broader consolidation structure after recovering sharply from its February lows near the $68 region. The token has managed to establish a higher base above the $80 support zone, which has now held for several weeks.
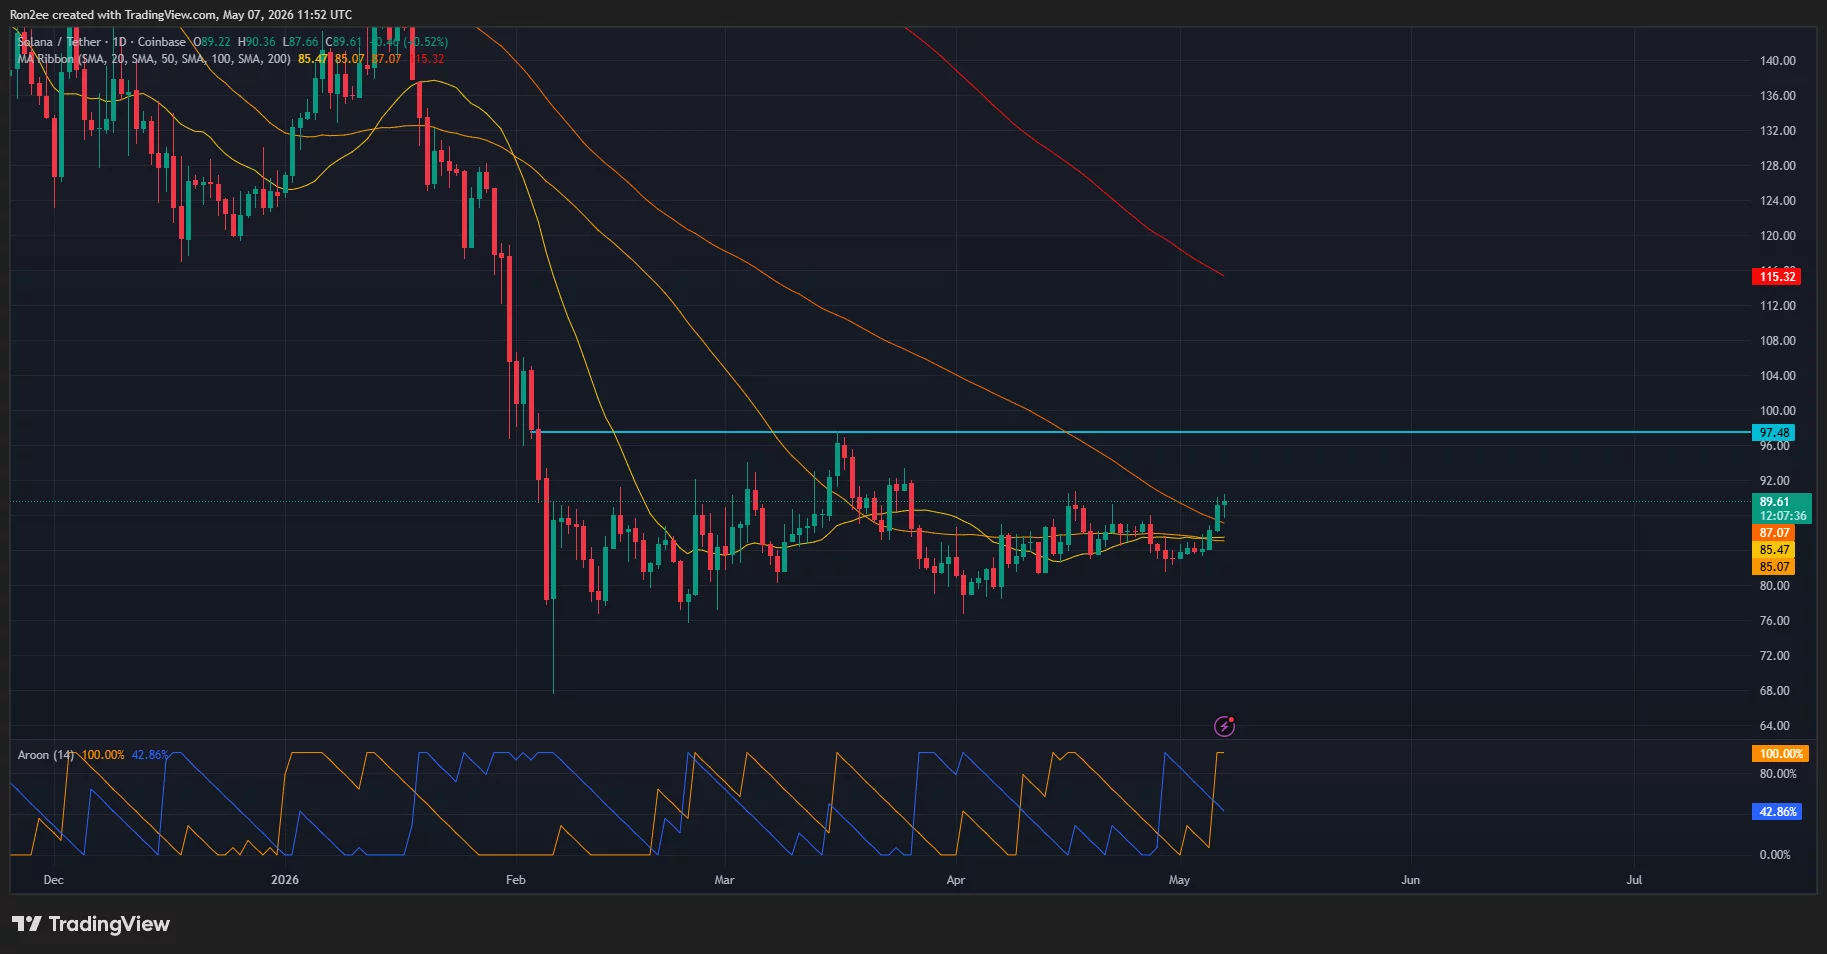
Currently, Solana is trading around the $89 region, slightly above its 20-day, 50-day, and 100-day simple moving averages, which are beginning to converge near the $85–$87 range. Such compression in moving averages often precedes a stronger directional move once price breaks decisively out of consolidation.
Importantly, momentum indicators are beginning to improve. The MACD lines are approaching a bullish crossover, which could signal strengthening buying momentum if confirmed in the coming sessions. Meanwhile, the Aroon Up indicator has surged toward 100 while the Aroon Down has weakened, suggesting buyers are gradually regaining short-term trend control.
However, the broader structure still remains cautious as Solana continues to trade well below its downward-sloping 200-day SMA near the $115 region, indicating that the higher timeframe trend has not fully turned bullish yet.
On the upside, a decisive daily close above the $90 resistance zone could open the door toward the next major resistance area around $97, followed by the key psychological $100 level. A successful breakout above that region would likely strengthen bullish sentiment further.
On the downside, failure to hold above the clustered moving averages near $85 could push Solana back toward the $80 support zone, where buyers have previously stepped in aggressively.
Disclosure: This article does not represent investment advice. The content and materials featured on this page are for educational purposes only.


You May Also Like

New Crypto Investors Are Backing Layer Brett Over Dogecoin After Topping The Meme Coin Charts This Month

Bitwise Enters Tokenization With $267M USCC Takeover