AT&T vs Verizon: The Better Dividend Stock For 2026
The post AT&T vs Verizon: The Better Dividend Stock For 2026 appeared first on 24/7 Wall St..
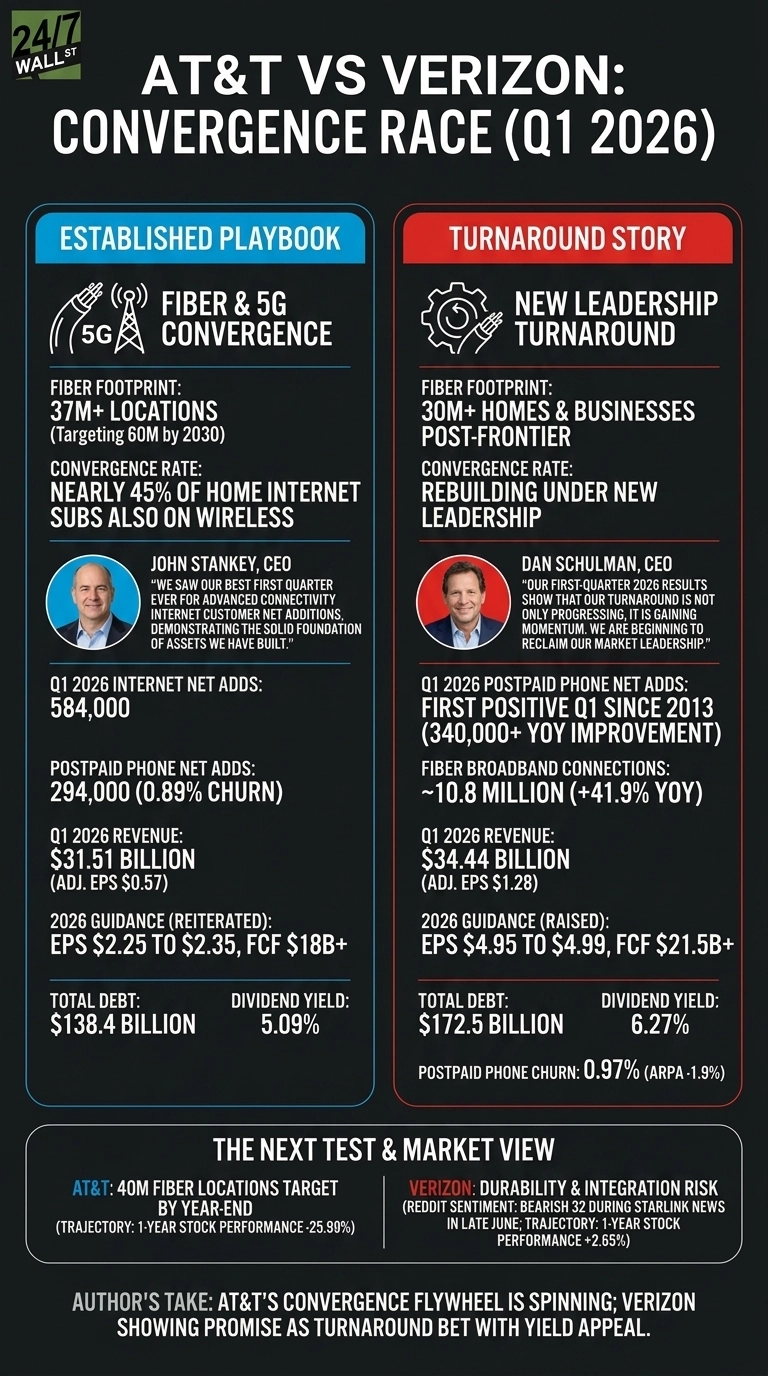
AT&T (NYSE:T) and Verizon (NYSE:VZ) both closed transformative fiber acquisitions early this year and just delivered Q1 2026 results that show two telecom giants racing toward the same convergence prize from very different starting points.
AT&T is running an established playbook. Verizon is executing a turnaround under a brand new CEO. The quarter makes their choices unusually easy to compare.
Fiber Momentum Carries One. A Turnaround Story Carries the Other.
AT&T posted $31.51 billion in revenue and adjusted EPS of $0.57, with consumer wireline broadband revenue jumping 27.3% to $2.80 billion after closing the Lumen Mass Markets fiber deal on February 2, 2026.
John Stankey told investors AT&T saw “our best first quarter ever for Advanced Connectivity internet customer net additions.” The numbers back him up: 584,000 internet net adds and 294,000 postpaid phone adds at a tight 0.89% churn. That is a well-oiled machine.
Verizon looks different. New CEO Dan Schulman inherited a franchise losing share, and Q1 delivered the first positive Q1 postpaid phone net adds since 2013, a swing of over 340,000 year over year. Revenue reached $34.44 billion with adjusted EPS of $1.28.
Fiber broadband connections climbed 41.9% to roughly 10.8 million after the Frontier deal closed January 20, 2026. Schulman called it a “turnaround” that is “gaining momentum.” A January network outage still cost 80 basis points of wireless service revenue growth, so this is momentum with scars.
 24/7 Wall St.
Convergence Leader vs Turnaround Bet
| Lens | AT&T | Verizon |
| Fiber footprint | 37M+ locations, targeting 60M by 2030 | 30M+ homes and businesses post-Frontier |
| Convergence rate | Nearly 45% of home internet subs also on wireless | Rebuilding under new leadership |
| 2026 guidance | Reiterated: EPS $2.25 to $2.35, FCF $18B+ | Raised: EPS $4.95 to $4.99, FCF $21.5B+ |
| Total debt | $138.4B | $172.5B |
| Dividend yield | 5.09% | 6.27% |
Stankey is doubling down on bundling fiber and 5G through the AT&T Guarantee. Schulman is stripping friction, cutting SG&A by 3.1%, and pushing business EBITDA margins to 26.5% from 23.1%.
Verizon still carries higher leverage and softer wireless economics: postpaid phone churn rose to 0.97% and ARPA slipped 1.9%.
The Next Test Is Whether Verizon Can Hold Its Gains
I will be watching whether AT&T hits its 40 million fiber locations target by year-end while keeping churn under one point. For Verizon, the question is durability.
One clean quarter of phone adds is not a trend, and the Starlink mobile narrative already spooked retail traders, dragging Reddit sentiment to a bearish 32 in late June. You should also keep an eye on integration costs from Frontier and whether Verizon repays that debt on schedule.
Why I Lean Toward AT&T Today, With a Caveat
Personally, I find AT&T’s story easier to trust right now. The convergence flywheel is already spinning, the fiber lead is real, and shares trade at just 7x trailing earnings after falling 25.99% over the past year.
For yield-focused investors, Verizon’s 6.27% dividend and raised guidance frame it as the turnaround story to watch, especially if Schulman keeps delivering. If input costs, Starlink pressure, or another outage rattle the group, I would rather own the operator already executing than the one still proving it can.
Act now: the analyst who called NVIDIA in 2010 just named his top 10 AI stocks — and Verizon didn’t make the cut. Grab the names FREE today.
The post AT&T vs Verizon: The Better Dividend Stock For 2026 appeared first on 24/7 Wall St..


You May Also Like

EUR/GBP Exchange Rate Surges as Bank of England Rate Hike Expectations Intensify – Market Analysis

Analysis reveals Trump’s extensive downtime