

Solana (SOL) Price: Record On-Chain Activity and ETF Inflows Point to July Recovery
TLDR
- Solana slipped 1.7% but held above key support levels while Bitcoin and Ethereum ETFs saw outflows
- U.S.-listed spot Solana ETFs pulled in $5.75 million in net inflows during the same period
- Weekly non-vote transactions topped 1 billion for the first time in Solana’s history
- Weekly active addresses surged from 16.8 million to 29.7 million in just two weeks
- Solana ranked #1 across all Layer 1 and Layer 2 chains in DApp revenue and DEX volume
Solana (SOL) dipped 1.7% to around $79–$80 during the latest reporting period, following Bitcoin’s 1.65% drop. The total crypto market cap fell 1.47% to $2.14 trillion. Despite the price slip, SOL held above key support.
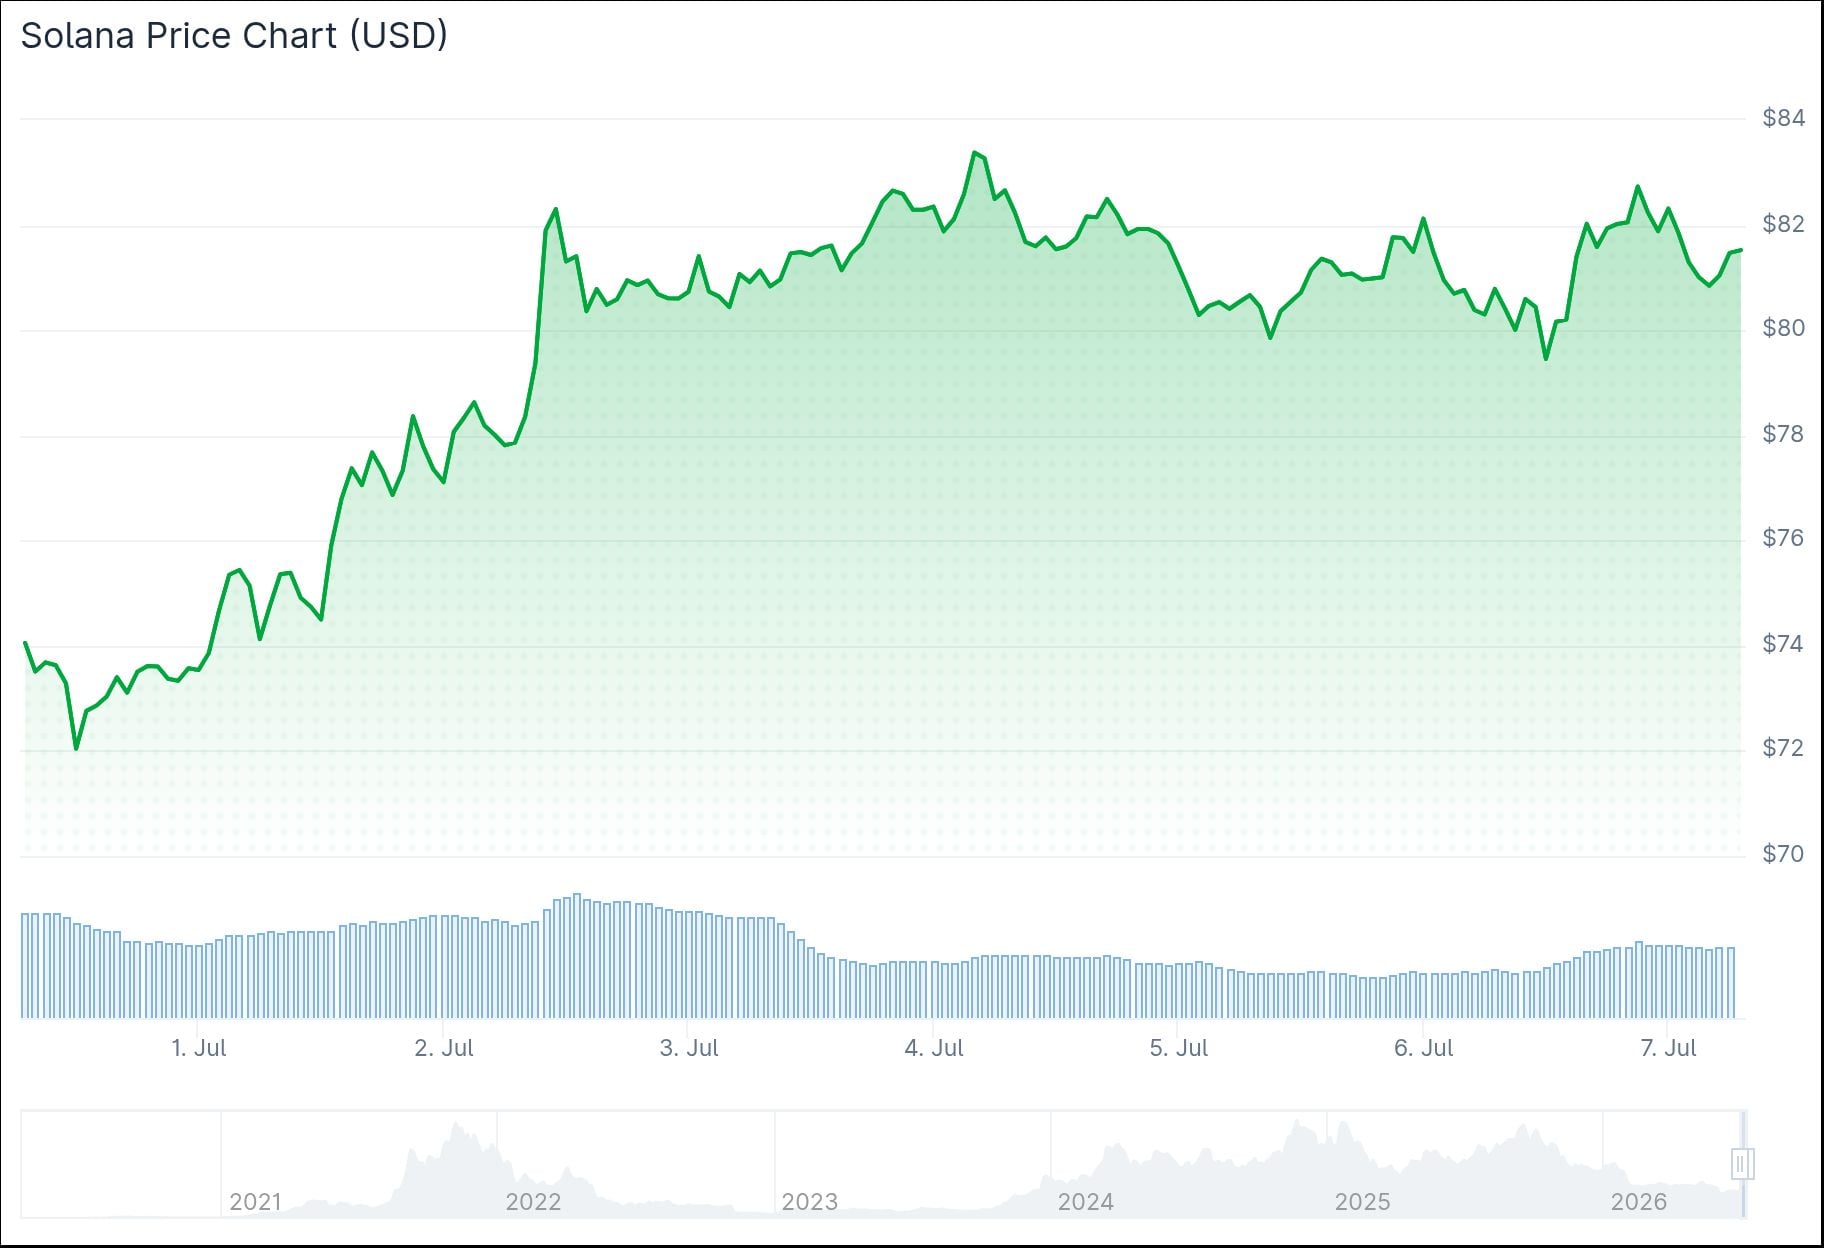 Solana (SOL) Price
The token is still roughly 73% below its all-time high of $294.33, set on January 19, 2025.
What stood out this week was how Solana’s ETF flows diverged from the rest of the market. Spot Bitcoin ETFs posted $527 million in net outflows between June 29 and July 2 — their eighth straight week of withdrawals. Spot Ethereum ETFs lost $13.67 million during the same stretch.
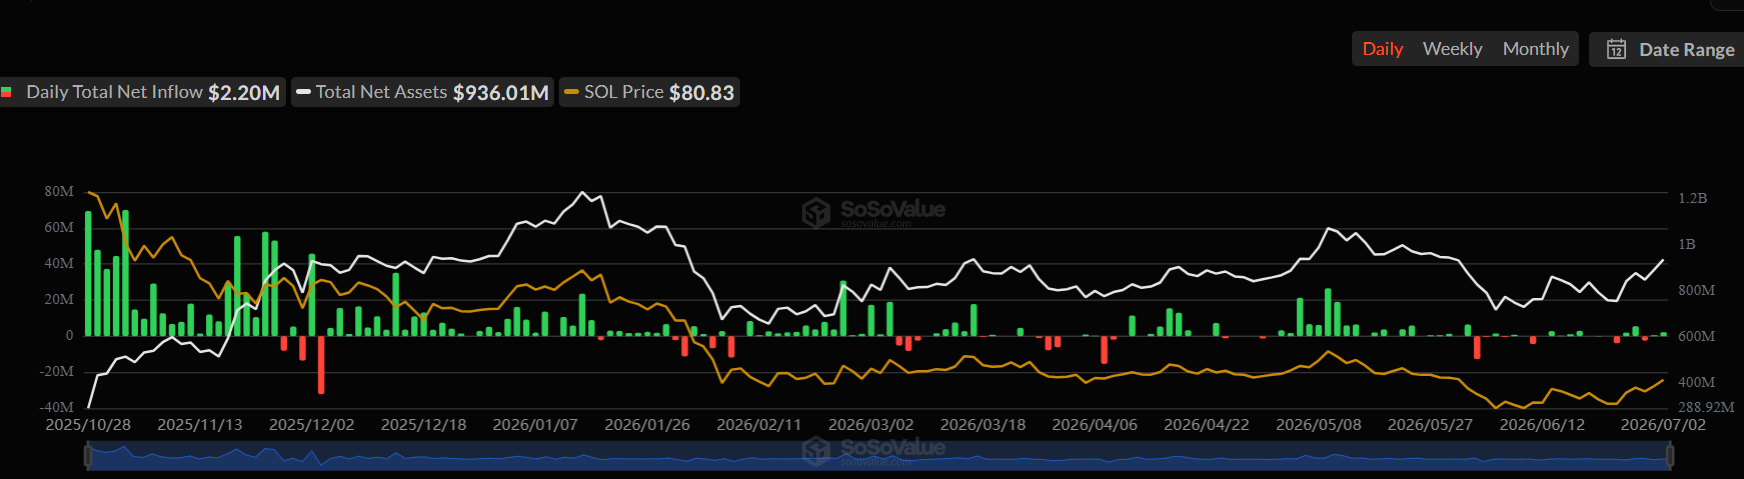 Source: SoSoValue
Solana went the other way. U.S.-listed spot SOL ETFs recorded $5.75 million in net inflows. XRP ETFs added $17.19 million, and HYPE ETFs brought in $4.32 million.
On-Chain Activity Breaks Records
Network usage hit a new milestone last week. SolanaFloor confirmed that weekly non-vote transactions crossed one billion for the first time. These are transactions from real users, apps, and traders — not validator votes — making this a meaningful measure of genuine activity.
Analyst Michaël van de Poppe weighed in on Solana’s price setup. He said the theory on $SOL remains unchanged — the price is breaking back into the range and a slight pullback before an upward continuation is expected. He said he wants to see $75–$77 hold as support, and if it does, he sees a move toward $100 and possibly $120 over the coming weeks and months.
Weekly active addresses also jumped, climbing from 16.8 million to 29.7 million in two weeks — a rise of roughly 76.8%. Solana also ranked first among all Layer 1 and Layer 2 chains in both 24-hour and seven-day DApp revenue, and led DEX volume across both timeframes. Polygon, Ethereum, Base, BNB Chain, and Hyperliquid followed.
Price Sits Between $80 Support and $85 Resistance
In terms of trading volume, Solana ranked second globally for the second straight week, processing $12.25 billion across centralized and decentralized exchanges. That beat Bybit’s $10.57 billion, though Binance held the top spot overall.
On the daily chart, SOL sits above its 20-, 50-, and 100-day moving averages. The MACD remains in bullish territory, though momentum has eased since last week’s 15% rally.
The RSI on the four-hour chart sat near 51–53, showing neutral momentum. The Supertrend indicator held below price near $78.30. Immediate resistance sits around $84–$85, while support levels at $78 and $76 are the key zones to watch.
The latest price at time of writing was approximately $80.34.
The post Solana (SOL) Price: Record On-Chain Activity and ETF Inflows Point to July Recovery appeared first on CoinCentral.


You May Also Like

Solana price confirms bearish crossover following Drift exploit, will it crash?

ON Semiconductor (ON) Stock: Drops as Fab Right Strategy Drives Two Site Sales

‘Sometimes you get along with the toughest people’: Trump moves to lift Turkey sanctions, clearing the country’s path back to F-35s



