Technical and onchain indicators hint at a possible trend reversal in XRP price as traders watch to see if a key support level holds.Technical and onchain indicators hint at a possible trend reversal in XRP price as traders watch to see if a key support level holds.

XRP price bottom signals emerge after the altcoin holds key support level

2026/04/11 13:07
3 min read
For feedback or concerns regarding this content, please contact us at [email protected]

XRP (XRP) has been in an eight-month downtrend, with momentum and onchain indicators at levels that previously coincided with macro bottoms.

Data from TradingView reveals that the relative strength index (RSI) of the XRP/BTC ratio is at 24, the most oversold level since October 2025. 

Such low levels in the daily RSI have marked market bottoms for the ratio, ultimately leading to 65% to 345% XRP price breakouts against Bitcoin as seen late 2024 and 2025.

XRP/BTC daily chart. Source: Cointelegraph/TradingView

The chart above also shows that the XRP/BTC pair is trading within a long consolidation range, which has previously acted as a strong launching pad for the ratio.

The last time XRP bottomed against Bitcoin around this zone was in June 2025. It marked the beginning of a 61% increase in the XRP/BTC ratio, accompanying a 92% XRP price rally to a multi-year high of $3.66.

Other instances shown by the yellow bars in the chart reinforce the reliability of this level in marking macro bottoms for XRP/BTC. 

MVRV Z-Score suggests XRP price is bottoming

XRP’s MVRV Z-score is hovering near zero, a level that historically aligns with accumulation zones and market bottoms.

This indicates that most holders are close to breakeven, reducing sell pressure and signalling potential downside exhaustion. Similar patterns appeared in 2021, 2022 and 2024 before major rallies.

XRP MVRV Z-score vs. price. Source: Glassnode

Note that the last time XRP’s MVRV Z-score fell to similar levels in late 2024 coincided with a macro market bottom at $0.30 and preceded a multi-month rally, with the XRP/USD pair rising 500% to a multi-year high above $3. 

Meanwhile, the 0.80 MVRV pricing band, which has historically marked cycle bottoms, is currently at $1.14, coinciding with a 15-month low reached on Feb. 6.

XRP: MVRV pricing bands. Source: Glassnode

These onchain metrics suggest that XRP is undervalued and may continue the ongoing recovery, potentially rising toward $1.70 or higher. 

XRP price must hold above $1.30 

Meanwhile, XRP/USD remains cautiously bullish as long as it holds the $1.25-$1.30 support zone. 

“$XRP is sustaining the major support zone between $1.30-$1.25 levels since early Feb'26,” trader ChiefraT said in an X post on Friday, adding:

XRP/USD daily chart. Source: Cointelegraph/TradingView

The importance of this support level is reinforced by cost basis distribution. The heatmap below shows that nearly 1.73 billion XRP were acquired around this price.

XRP cost-basis distribution heatmap. Source: Glassnode

Below that, the next line of defence is the $1.15 demand zone, where the 200-week simple moving average is. 

If XRP/USD drops below this level, it would be in a free-fall toward the measured target of the bear flag at $0.80, or 41% below the current price.

As Cointelegraph reported, holding $1.27-$1.30 would be a sign of strength among the bulls who must push the XRP/USD pair toward the $1.61 range high to regain control. 

This article is produced in accordance with Cointelegraph's Editorial Policy and is intended for informational purposes only. It does not constitute investment advice or recommendations. All investments and trades carry risk; readers are encouraged to conduct independent research before making any decisions. Cointelegraph makes no guarantees regarding the accuracy or completeness of the information presented, including forward-looking statements, and will not be liable for any loss or damage arising from reliance on this content.

  • #Cryptocurrencies
  • #Altcoins
  • #XRP
  • #Markets
  • #Price Analysis
  • #Market Analysis
  • #Altcoin Watch
Market Opportunity
XRP Logo
XRP Price(XRP)
$1,2893
$1,2893$1,2893
-3,50%
USD
XRP (XRP) Live Price Chart

AI Strategy: Powered 24/7

AI Strategy: Powered 24/7AI Strategy: Powered 24/7

Generate automated strategies using natural language

Disclaimer: The articles reposted on this site are sourced from public platforms and are provided for informational purposes only. They do not necessarily reflect the views of MEXC. All rights remain with the original authors. If you believe any content infringes on third-party rights, please contact [email protected] for removal. MEXC makes no guarantees regarding the accuracy, completeness, or timeliness of the content and is not responsible for any actions taken based on the information provided. The content does not constitute financial, legal, or other professional advice, nor should it be considered a recommendation or endorsement by MEXC.

You May Also Like

Crypto Industry Flexes Political Muscle in Texas Primary Victories

Crypto Industry Flexes Political Muscle in Texas Primary Victories

Crypto PACs invested $10M+ in Texas primaries, ousting Rep. Al Green. Analysis of victories, spending patterns, and implications for digital asset policy. The post
Share
Blockonomi2026/05/28 14:42
Sterling Weakens As Dollar Soars On Geopolitical Escalation And Bailey’s Cautious Stance

Sterling Weakens As Dollar Soars On Geopolitical Escalation And Bailey’s Cautious Stance

The post Sterling Weakens As Dollar Soars On Geopolitical Escalation And Bailey’s Cautious Stance appeared on BitcoinEthereumNews.com. British Pound Plummets: Sterling
Share
BitcoinEthereumNews2026/04/02 17:45
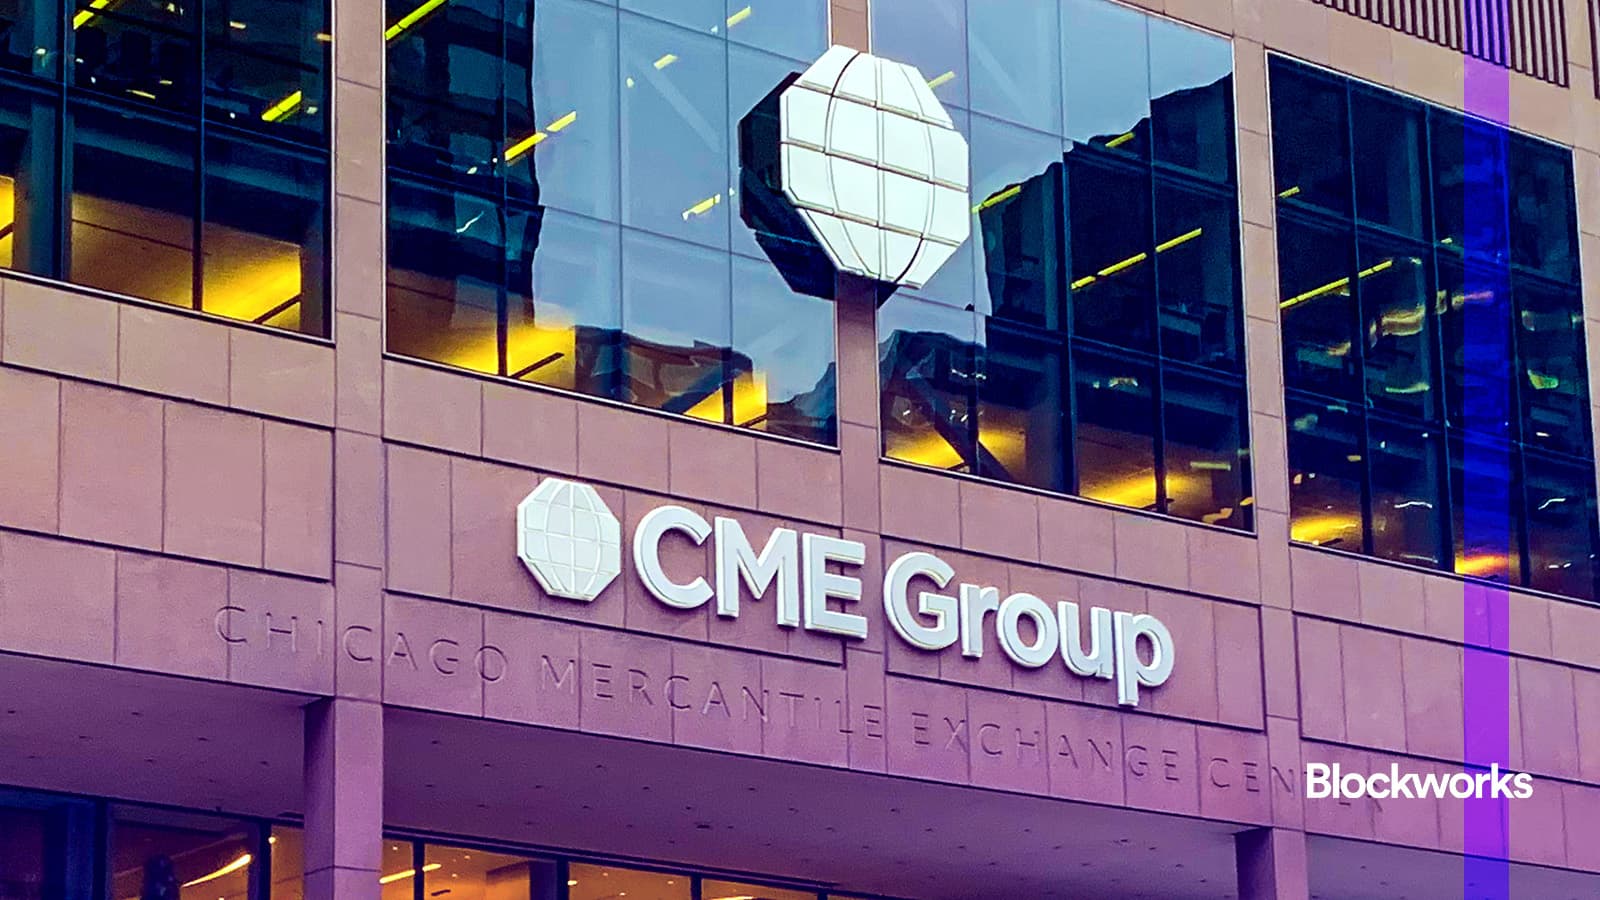
CME Group to launch Solana and XRP futures options in October

CME Group to launch Solana and XRP futures options in October

The post CME Group to launch Solana and XRP futures options in October appeared on BitcoinEthereumNews.com. CME Group is preparing to launch options on SOL and XRP futures next month, giving traders new ways to manage exposure to the two assets.  The contracts are set to go live on October 13, pending regulatory approval, and will come in both standard and micro sizes with expiries offered daily, monthly and quarterly. The new listings mark a major step for CME, which first brought bitcoin futures to market in 2017 and added ether contracts in 2021. Solana and XRP futures have quickly gained traction since their debut earlier this year. CME says more than 540,000 Solana contracts (worth about $22.3 billion), and 370,000 XRP contracts (worth $16.2 billion), have already been traded. Both products hit record trading activity and open interest in August. Market makers including Cumberland and FalconX plan to support the new contracts, arguing that institutional investors want hedging tools beyond bitcoin and ether. CME’s move also highlights the growing demand for regulated ways to access a broader set of digital assets. The launch, which still needs the green light from regulators, follows the end of XRP’s years-long legal fight with the US Securities and Exchange Commission. A federal court ruling in 2023 found that institutional sales of XRP violated securities laws, but programmatic exchange sales did not. The case officially closed in August 2025 after Ripple agreed to pay a $125 million fine, removing one of the biggest uncertainties hanging over the token. This is a developing story. This article was generated with the assistance of AI and reviewed by editor Jeffrey Albus before publication. Get the news in your inbox. Explore Blockworks newsletters: Source: https://blockworks.co/news/cme-group-solana-xrp-futures
Share
BitcoinEthereumNews2025/09/17 23:55

No Chart Skills? Still Profit

No Chart Skills? Still ProfitNo Chart Skills? Still Profit

Copy top traders in 3s with auto trading!