

Crypto Price Prediction for Today, June 7: XRP, Ethereum (ETH), Solana (SOL)
The Crypto market is up 3% today to $2.13 trillion. It hit a yearly low of $2.1 trillion, then bounced. The 7-day RSI for the whole market was at 7. The Fear & Greed Index hit 14, “Extreme Fear.” Bitcoin liquidations fell 92% to $47 million, which eased the forced selling.
However, what happens today will tell us a lot. Either these coins bounce back, or sellers stay in charge.
XRP Price Bounces From Yearly Lows as EVM Sidechain Goes Live
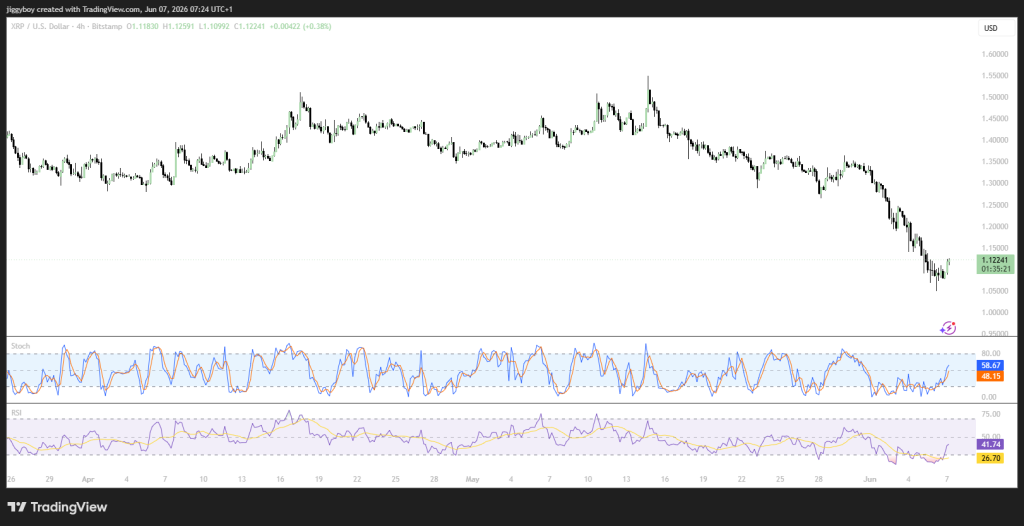
Ripple’s XRP is trading at $1.12241 after a 2.2% gain today. We had a look at the XRP chart and found the price reached a high of $1.12591 and a low of $1.10992 during this session.
The XRP price has been under heavy pressure for weeks, but today’s bounce shows buyers stepping in near the $1.11 level.
 Source: Tradingview.com
The RSI is 41.16. That is below the middle line, so sellers still have a small edge. The Stochastic is 56.81. That favors buyers and suggests upward momentum is getting better.
The Ultimate Oscillator is 56.69. That is another number showing buyers are taking over. The MACD is 0.00611, a positive reading that confirms selling pressure has weakened.
| Indicator Metric | Reading | Interpretation |
|---|---|---|
| RSI (14) | 41.16 | Sellers still hold a small advantage |
| STOCH (9,6) | 56.81 | Upward momentum is improving |
| MACD (12,26) | 0.00611 | Bearish momentum has weakened |
| Ultimate Oscillator | 56.69 | Buyers are gaining control |
Key Factors Pushing the XRP Price
The XRPL EVM Sidechain mainnet is now live. That means Ethereum apps can now work with XRP. Developers can build smart contracts without touching the main XRP Ledger. Tokens can move between the main ledger and the sidechain, which opens things up for new DeFi projects.
The sidechain is built on the Cosmos EVM stack and connects using IBC technology.. It uses Axelar to access over 80 blockchains from day one. That makes the XRP ecosystem more connected and useful for developers.
Trading activity is still a bright spot for the XRP price. XRP remains one of the most traded coins on South Korea’s Upbit exchange, even after losing about 15% this past week. Strong volume points to continued demand.
The CLARITY Act passed through the Senate Banking Committee in May 2026. If it becomes law and classifies XRP as a non-security commodity, big money and ETF demand would follow. Large holders are also showing confidence. Wallets holding between 100 million and 1 billion XRP have accumulated hundreds of millions of tokens during this market weakness.
XRP Price Prediction for Today
Bullish Path:
First, XRP needs to get past $1.1259. If it does, the next stop is $1.15. A move above $1.15 would then bring $1.20 into view.
Neutral Path:
If XRP holds above $1.1099, the price could stay put for most of the session. It might then just drift sideways between $1.1099 and $1.1259 while buyers and sellers go back and forth.
Bearish Path:
A drop below $1.1099 is a bad sign. XRP could fall toward $1.09. If it cannot bounce back from there, lower prices near $1.05 could follow
Ethereum Price Rebounds as Bitmine Accumulates Over 484,000 ETH in 2026
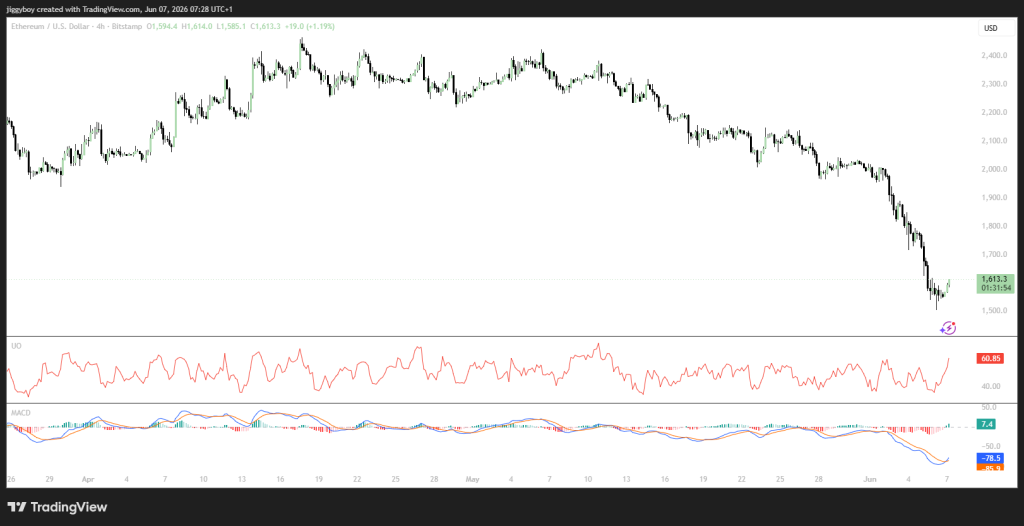
Ethereum is up 2.9% today to $1,613.30. We checked the chart. The high hit $1,614.00, and the low was $1,585.10. Ethereum has been falling hard, but today’s bounce pushed it back over $1,600.
 Source: Tradingview.com
The RSI is 33.51. That is deep in oversold territory. It tells you the selling has been extreme. The Stochastic is 38.37, which is also getting close to oversold levels.
The Ultimate Oscillator is 59.74. That is one of the more hopeful signs. It shows buyers have stepped in with real force. The MACD is 7.1, a positive number that confirms momentum has turned bullish for this session.
| Indicator Metric | Reading | Interpretation |
|---|---|---|
| RSI (14) | 33.51 | Deep oversold, selling has been extreme |
| STOCH (9,6) | 38.37 | Approaching oversold territory |
| MACD (12,26) | 7.1 | Momentum has turned bullish |
| Ultimate Oscillator | 59.74 | Buyers have stepped in with force |
Key Factors Pushing the Ethereum Price Presently
Bitmine, a firm tied to investor Tom Lee, has bought over 484,000 ETH so far in 2026. That is one of the biggest corporate Ethereum buys this year. It is a good sign for the Ethereum price because it shows real demand from big money.
They are treating ETH as a long-term asset, which sends a strong vote of confidence even while prices are falling. The broader altcoin market also showed some life. The Altcoin Season Index rose nearly 7% in one day, giving the downtrend a break.
On the other side, on-chain data shows 2.24 million ETH moved into exchanges in a single day. That is the most in four months. Binance got more than half of those deposits. That is a bad sign for the Ethereum price in the short term because large exchange inflows often come before selling.
Also, a wallet tied to Ethereum co-founder Joseph Lubin moved 80,001 ETH worth $121.6 million after nearly three years of sitting still. No one knows yet if those funds will be sold or put into staking.
Related Ethereum News: Crypto Liquidations Hit Hard – Bitcoin and Ethereum Open Interest at Multi‑Month Lows
Ethereum Price Prediction for Today
Bullish Case:
Ethereum first needs to get above $1,614. If it does, the next stop is $1,650. A move past $1,650 would then put $1,700 in play.
Neutral Case:
If Ethereum stays above $1,585, the price could hold steady for most of the session. It might then drift sideways between $1,585 and $1,614 while the market digests all the ETH flowing into exchanges.
Bearish Case:
A drop below $1,585 is a bad sign. Ethereum could fall toward $1,550. If it cannot bounce back from there, lower prices near $1,500 would be next.
Solana Price Rises as Meta Expands Stablecoin Payouts Using the Network
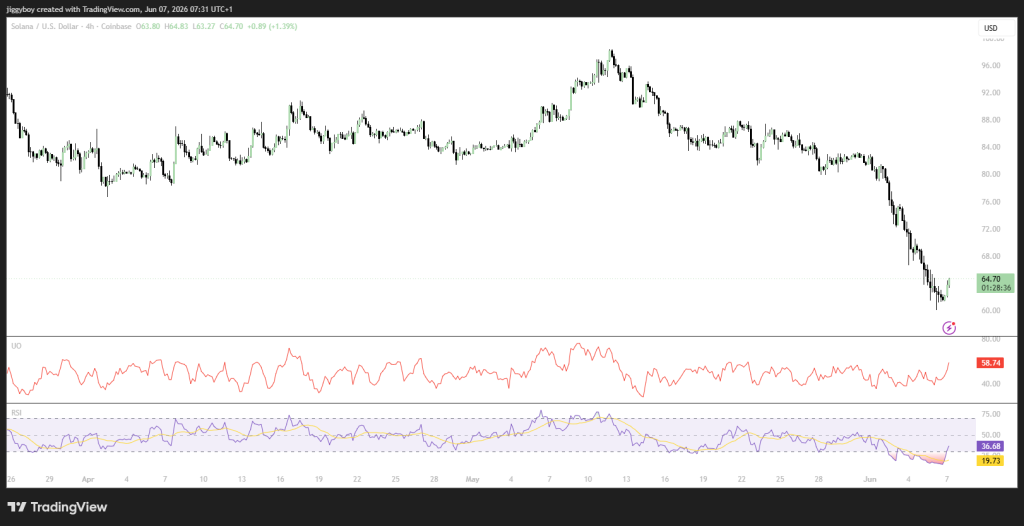
The Solana price is trading at $64.70 after a 2.7% gain today. We looked at the Solana chart. The high was $64.83, and the low was $63.27. Solana has been falling for weeks, but today’s bounce pushed it back above $64.
 Source: Tradingview.com
The RSI is 36.68. That is in oversold territory. It tells you sellers have worn themselves out. The Stochastic is 51.18, a neutral number leaning slightly toward buyers.
The Ultimate Oscillator is 58.68. That is positive and shows buyers are in control this session. The MACD is 0.41, another positive number that confirms momentum has turned bullish.
| Indicator Metric | Reading | Interpretation |
|---|---|---|
| RSI (14) | 36.68 | Oversold, sellers have exhausted themselves |
| STOCH (9,6) | 51.18 | Neutral, leans slightly toward buyers |
| MACD (12,26) | 0.41 | Momentum has turned bullish |
| Ultimate Oscillator | 58.68 | Buyers are in control |
Key Factors Pushing the Solana Price Presently
Meta expanded its USDC stablecoin payout system for creators to the Philippines and Colombia. It runs on Solana and Polygon. The system is faster and cheaper than traditional bank payments. Meta plans to bring it to over 160 countries.
That validates Solana’s usefulness for high-volume, low-cost transactions. Solana’s core teams are also aiming to release the Alpenglow upgrade in 2026. That would cut block finality from 12.8 seconds down to 100 to 150 milliseconds. That is a big improvement in speed and reliability for financial apps.
In March 2026, the SEC and CFTC together recognized SOL as a digital commodity. They also said protocol staking is exempt from securities rules. That clarity has sped up partnerships with big firms like Mastercard, Western Union, and Canada’s Balance.
Clearer rules remove a major roadblock for institutions. It also allows products like spot ETFs to pull in steady money. Bitwise’s Solana Staking ETF saw inflows right after launch.
Solana Price Prediction for Today
Bullish Path:
First, Solana needs to break above $64.83. If it does, the next target is $66.00. A move past $66.00 would then put $68.00 in play.
Neutral Path:
A hold above $63.27 could keep the Solana price stable for most of the session. The Solana price may then consolidate between $63.27 and $64.83 as the market digests the Meta news.
Bearish Path:
A drop below $63.27 is a bad sign. Solana could then fall toward $62.00. If it cannot bounce back from there, lower prices near $60.00 could come next.
Frequently Asked Questions

Yes, XRP could reach $10, but it would likely require much stronger institutional adoption, ETF demand, and wider use of Ripple’s payment network. Regulatory clarity, including progress on the CLARITY Act, would also be important for attracting larger investors and supporting higher valuations.
Ethereum reaching $10,000 is possible if ETF inflows remain strong, network activity continues growing, and staking keeps a large portion of ETH locked out of circulation. However, broader market conditions and competition from other blockchains could affect how quickly that target is reached.
Solana remains one of the leading blockchain networks due to its fast transaction speeds, low fees, and growing adoption in payments and stablecoins. Continued institutional interest, network upgrades, and ecosystem growth could help strengthen its position over the coming years.
Subscribe to our YouTube channel for daily crypto updates, market insights, and expert analysis.
The post Crypto Price Prediction for Today, June 7: XRP, Ethereum (ETH), Solana (SOL) appeared first on CaptainAltcoin.


You May Also Like
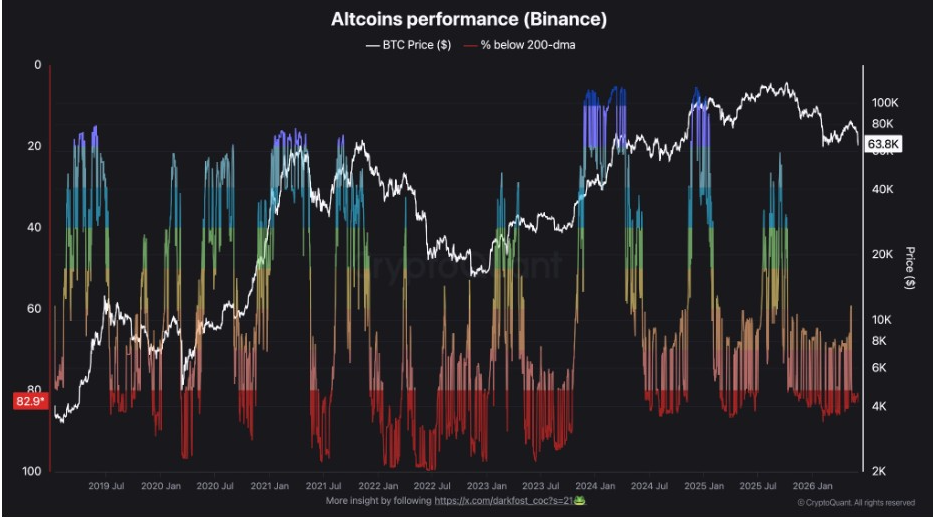
Altcoin Market Loses $520B as 83% Trade Below 200-Day Average

How Bitcoin Turned $10K Into $119 Million While Facebook Lagged Behind

US eyes Iranian assets for Gulf allies’ reconstruction, source says


