

Analyst Says Everyone Misunderstood The M2-Bitcoin Relationship, Here’s What Happens
The relationship between Bitcoin and the M2 Global Money supply chart has been a long one in the making, with similarities over the years. Given that both of these have seemed to follow each other over the years, the M2 rising has been something that analysts have pointed out as bullish for Bitcoin. However, with the recent deviation, calls for the similarities have died down, with many believing that the correlation has ended. But one analyst has stood out, saying the chart is misunderstood.
The Bitcoin Price Is Still Following The M2 Chart
Crypto analyst KillaXBT shared a chart showing the M2 performance compared to the Bitcoin performance. But instead of just showing recent years, the analyst shows the correlation over the last three bull and bear market cycles, to show that the two have always followed each other.
The analysis suggests that investors who have been plotting the two charts together have been doing it wrong and actually misunderstood how the correlation worked. According to KillaXBT, the deviation that has made people abandon the M2 chart is nothing out of the ordinary and is, in fact, following the correct trend.
The current downside that the Bitcoin price is seeing, the analyst explains, actually follows what has happened in the past when the M2 had topped. The result for Bitcoin has always been a crash after the M2 reaches its peak, effectively plunging it into a bear market.
As the crypto analyst explains, the sequence that the M2 tops and then Bitcoin tops is wrong. Rather, it is the other way around, where the Bitcoin price first reaches a top. Following this, the M2 continues to rise while the Bitcoin price ranges for a while. Then, once the M2 finally reaches its peak, it leads to a prolonged downtrend for Bitcoin.
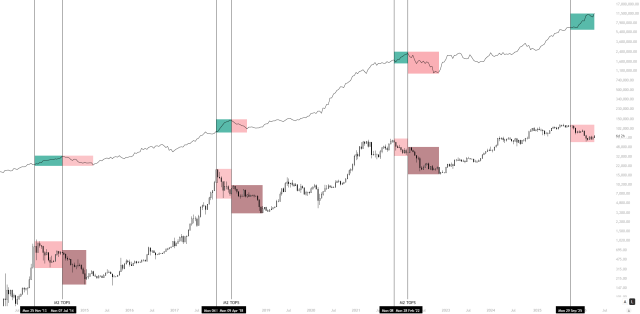
In the analysis, KillaXBT explained that the M2 has actually not topped. Hence, it continues to move upwards. If this analysis is correct, then it means that the Bitcoin decline is far from over, given that the price usually drops once the M2 peaks.
Related Reading: Zachxbt Identifies Other Cryptos Like RAVE With The Same Trajectory, What Do They Have In Common?
Given that this trend has been repeated in the last three cycles, the analyst explains that it is unlikely to decouple this time around. As a result, investors should brace for impact as to when the M2 finally peaks before Bitcoin can reach a bottom.


추천 콘텐츠

Arthur Hayes Sees 20x Upside For NEAR, 5x For Zcash Within One Year

Mouse and GXChain to Offer Seamless Blockchain Access for TON Gaming Community

Russell Index Additions: SharpLink, Bitmine, and Galaxy Digital Gain Major Benchmark Status


인기 뉴스
더보기
