

BNB Accumulation Builds As Traders Eye Long Term Move Toward $5000 Target Zone
BNB trades near $640, holding above $630 support as traders watch $700 resistance and a long-term $5,000 target.
BNB accumulation has returned to market discussion as traders track a long-term target zone near $5,000.
BNB trades near $640, while short-term pressure remains active below key resistance.
The current BNB price setup shows a wide range between support and recovery levels, and traders are watching whether buyers can defend the $600 area.
BNB Price Holds Inside Key Trading Range
BNB was trading near $640.28 on the daily chart, down about 1.56%. The latest move followed a failed attempt to hold near the recent high of $689.98.
The daily candle showed weakness, with price moving between $635.29 and $653.00.
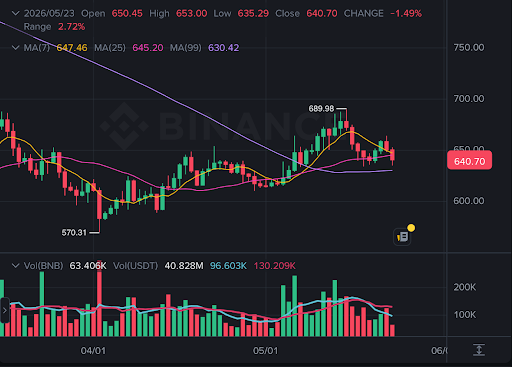 BNB price tests moving averages after pullback. Source: Binance chart
The chart shows BNB trading inside a broad range between $600 and $700. This range has become important after the sharp fall from the prior high above $1,200.
Price remains near the middle of the range, so the market has not shown a clear direction.
BNB also remains below the wider rising fan structure seen on the chart. A move back into that structure would be needed for a stronger recovery setup.
For now, traders are watching the $670 to $700 area as the next resistance zone.
A close above $700 could open the way toward $750 and $800. However, failure to reclaim that area may keep BNB locked inside the current range. The next major support remains near $600.
Traders Watch BNB Accumulation Zone
Some analysts continue to discuss a possible BNB accumulation phase. One market analyst said, “BNB is being accumulated,” while listing an entry zone between $500 and $300.
The same post placed long-term targets at $2,000, $3,000, and $5,000.
The post also included “NFA” and “DYOR,” meaning not financial advice and doing your own research.
These terms are often used when traders share personal market views. They do not confirm future price action.
The live chart does not yet confirm a long-term move toward $5,000. BNB remains below $700 and still faces near-term selling pressure.
A stronger trend would require price to reclaim resistance and hold higher levels.
Support near $635 to $630 is important in the current setup. BNB is also trading close to the MA(99), which sits near $630.42.
A daily close below this level could weaken the medium-term structure. If BNB loses $630, the next support levels may sit near $610 and $600.
A deeper pullback could bring $560, $540, and $500 into focus. That would also place prices closer to the lower accumulation zone discussed by traders.
Read Also:
Technical Indicators Remain Cautious
BNB is trading below the MA(7) at $647.46 and the MA(25) at $645.20. This shows short-term sellers still have control.
The price needs to move back above these averages to ease immediate pressure.
However, BNB remains above the MA(99), which keeps the broader setup from breaking down fully.
This makes the $630 area a key level for both buyers and sellers. Holding above it may support another attempt toward $670.
The MACD remains mixed on the daily chart. The MACD line sits below the signal line, while the histogram is slightly negative.
This shows bearish momentum is present, though it has not expanded sharply.
 BNB price consolidates near key range support. Source: TradingView.
The RSI is near 47, which is below the neutral 50 mark. This means buyers have not gained clear control. A move above 50 would show improving momentum.
BNB bulls need a daily close above $700 to shift the short-term trend. Bears need a break below $600 to confirm another lower move.
Until then, BNB price remains range-bound as traders watch accumulation claims and the long-term $5,000 target zone.
The post BNB Accumulation Builds As Traders Eye Long Term Move Toward $5000 Target Zone appeared first on Live Bitcoin News.


추천 콘텐츠

Alarm as GOP lawmakers hand themselves cash offer: 'Republicans in Congress did what???'
'Biggest wealth divide in modern history': Shocking graphic shows reality of US economy

Iran’s foreign minister targeted in assassination attempt, wife killed


인기 뉴스
더보기
