

Solana (SOL) Price Analysis: Critical Levels That Could Define the Next Move
Key Takeaways
- SOL currently trades around $82, representing approximately a 70% decline from its peak near $295
- Critical near-term resistance level positioned at $95 — closing above this on the weekly chart could trigger relief rally
- Current support zone exists between $78–$83; breaking below may lead to testing the $60 level
- The 50-week EMA positioned near $124 serves as significant overhead resistance for any major recovery attempt
- Trading volume increased 10% to reach $3.89 billion despite downward price movement, indicating substantial selling activity
Solana finds itself in a challenging position at present. The cryptocurrency has been hovering around $82 on daily timeframes and $86 on weekly charts, positioned well beneath the marked support area near $95 that market participants have been monitoring closely.
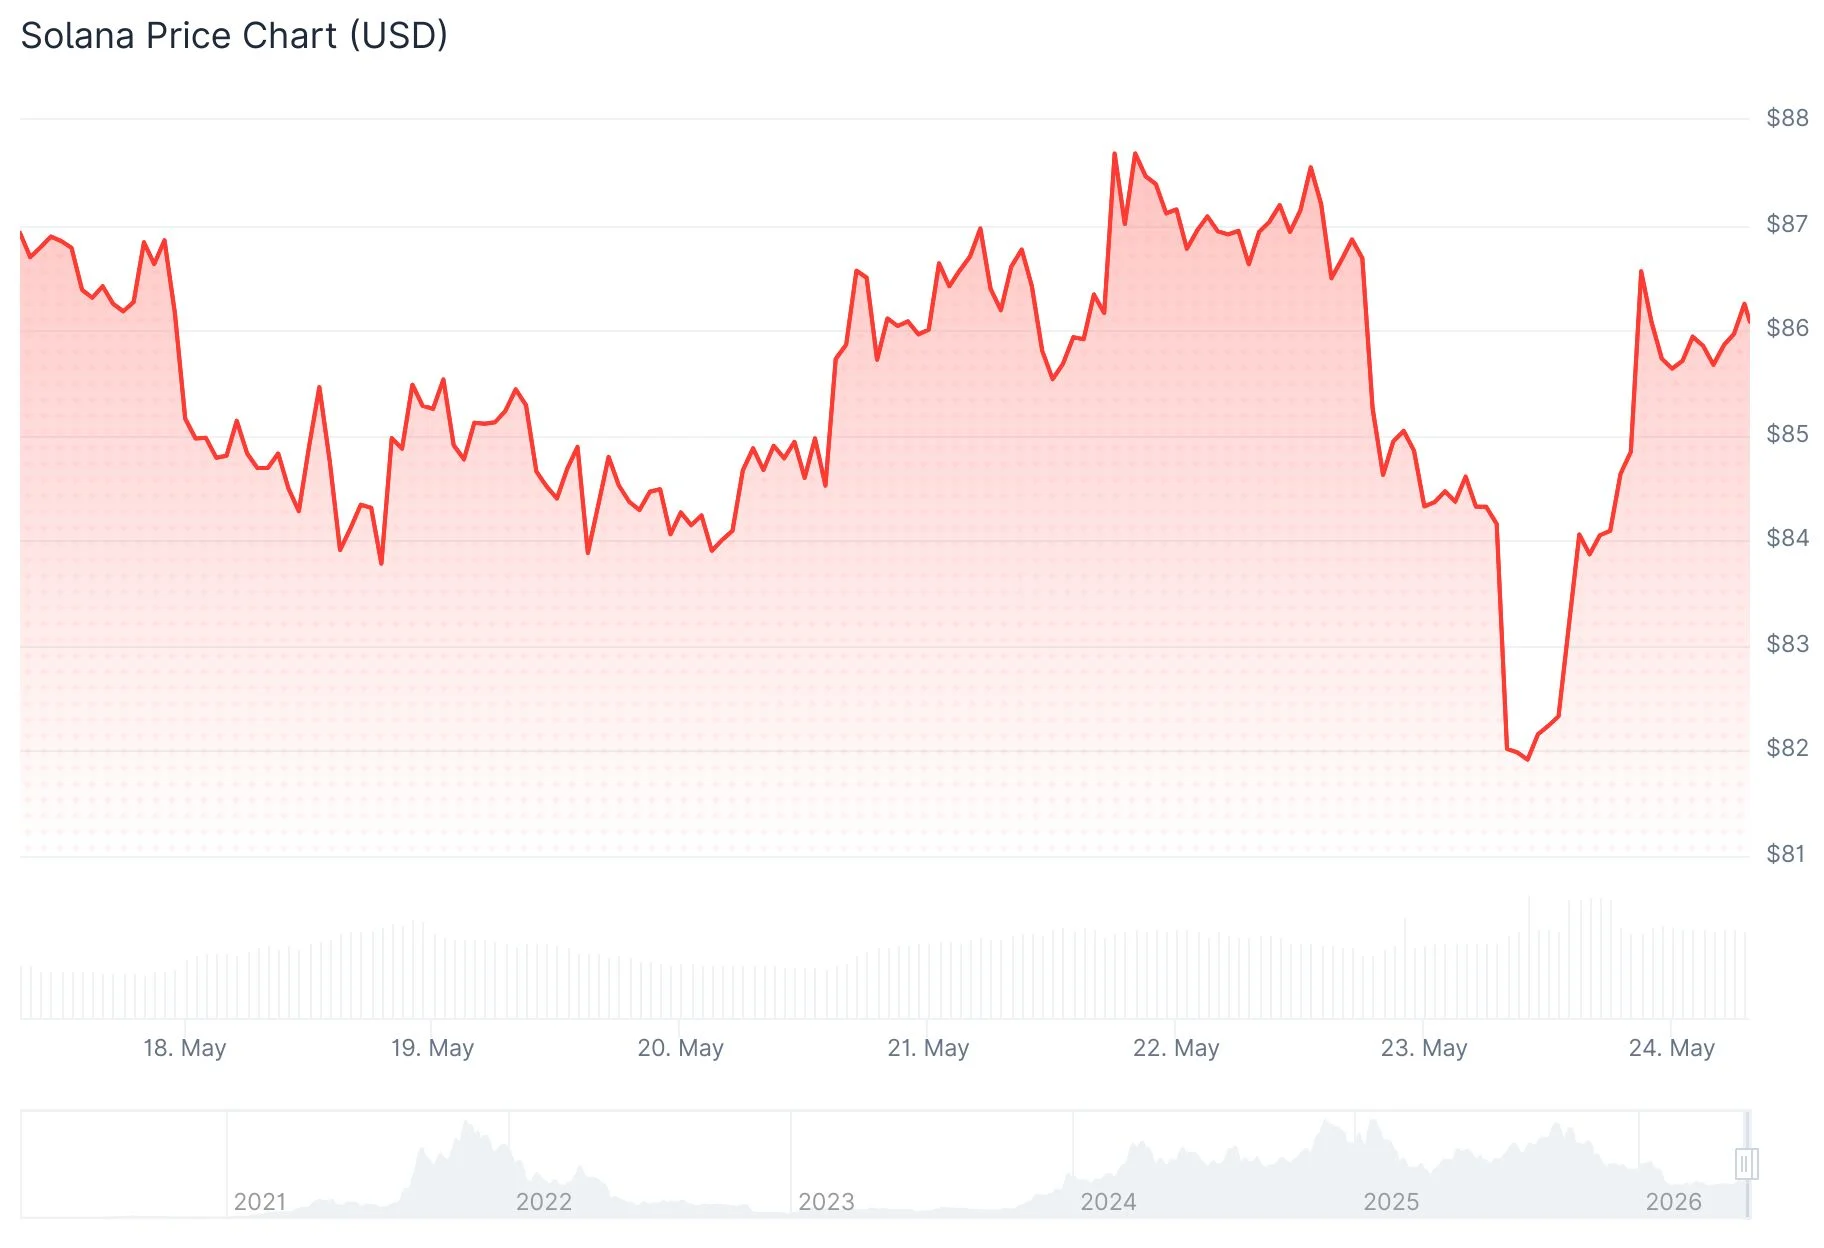 Solana (SOL) Price
The decline from its previous peak near $295 has been substantial — approximately 70% — and market psychology reflects this downturn. Cryptocurrency analyst Whale Watch expressed it succinctly on social media: “Everyone loved SOL at $295. Nobody wants it at $86.” This observation encapsulates the prevailing sentiment effectively. It highlights diminished demand during a significant correction, a phenomenon commonly observed in deep retracements where retail participation evaporates exactly when valuations are most attractive.
Purchasers have maintained the $78–$83 area for the time being, though momentum remains weak. A weekly candle closing beneath $83 would undermine the existing technical formation.
Technical Indicators and Chart Patterns
Experts at Elliott Wave Academy suggest SOL might be developing a near-term corrective bounce. Their technical assessment identifies a potential advance toward the 50%–61.8% Fibonacci retracement of the recent decline, with possibilities to extend toward the 78.6% level should buying pressure intensify. However, they emphasize that price behavior near those thresholds will be crucial in determining subsequent movements.
Analysts from MCO Global DE characterize recent price action as primarily “noise,” without a definitive breakout in either direction. They identify immediate support at $81.28, alongside a more robust support band spanning $71.92 to $77.96. These zones have absorbed considerable selling pressure throughout recent downward moves. The firm additionally cautions that another near-term decline remains possible before any significant recovery effort materializes.
For any meaningful recovery to take hold, SOL must first overcome $95. Following that breakthrough, focus would transition to the 50-week EMA near $124, which has functioned as solid resistance since SOL fell below it earlier in the year. A sustained close above $124 would create opportunities toward $175 and potentially $200.
Volume Trends Suggest Increased Selling Pressure
CoinMarketCap information reveals SOL trading at $82.21, declining 5.83% over the previous 24-hour period. The market capitalization stands at $47.51 billion. Daily trading volume climbed 10.04% to reach $3.89 billion.
The increase in volume concurrent with price deterioration deserves attention. This pattern generally signals active selling pressure rather than passive consolidation. Resistance exists within the $90–$95 range on near-term charts.
The crucial technical obstacle at $96 remains intact. Until purchasers can reclaim that threshold decisively, the market structure is anticipated to remain neutral.
Analysts further identify $110 as an extended-term resistance area that may determine whether Solana initiates a genuine trend reversal or continues range-bound trading.
SOL currently changes hands near $82.21, with support established at $80 and resistance spanning $90 to $95.
The post Solana (SOL) Price Analysis: Critical Levels That Could Define the Next Move appeared first on Blockonomi.


추천 콘텐츠

FTX victims to receive $54M from Fenwick & West in settlement

CoreWeave (CRWV) Stock Surges 12% on $8.5B GPU-Backed Financing Deal — Here’s the Full Picture

OpenAI and Anthropic now sit at the center of Big Tech’s AI cloud backlog


인기 뉴스
더보기
