

Solana (SOL) Price: The Chart Setup Every Solana Holder Needs to See Right Now
TLDR
- SOL is trading near $82, down roughly 70% from its all-time high near $295
- Key short-term resistance sits at $95 — a weekly close above it would signal a relief move
- Immediate support holds between $78–$83; a break below could expose $60
- The 50-week EMA near $124 remains a firm overhead barrier for any broader recovery
- Daily trading volume rose 10% to $3.89 billion despite the price drop, pointing to active selling
Solana is stuck in a difficult spot right now. The token has been trading around $82 on the daily chart and $86 on the weekly view, sitting well below the dotted support zone near $95 that traders have been watching closely.
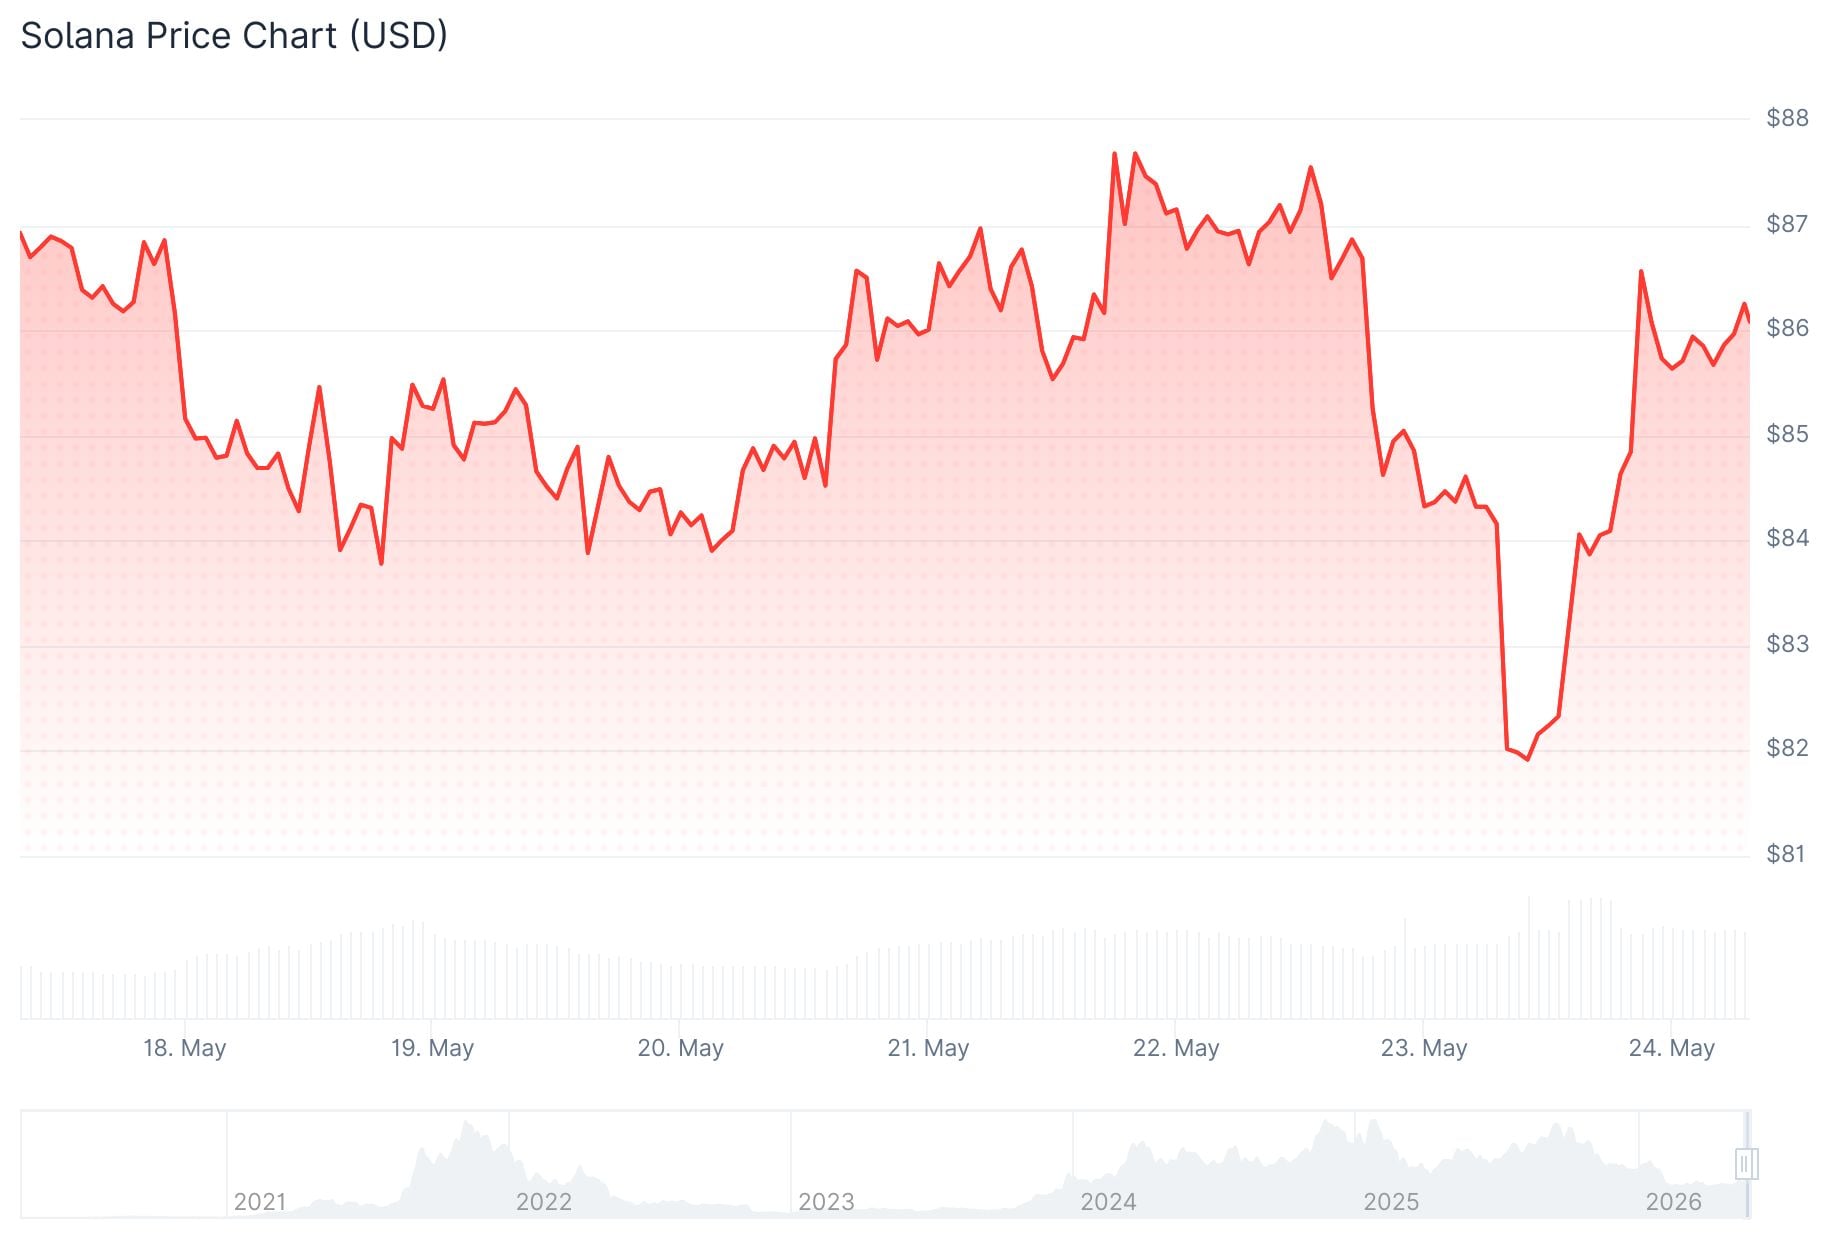 Solana (SOL) Price
The drop from its prior high near $295 has been steep — about 70% — and market sentiment reflects that pain. Crypto analyst Whale Watch put it plainly on social media: “Everyone loved SOL at $295. Nobody wants it at $86.” That tweet captures the current mood well. It points to weak demand during a sharp correction, a pattern often seen in deep pullbacks where retail interest dries up precisely when prices are at their lowest.
Buyers have defended the $78–$83 range for now, but momentum is thin. A weekly close below $83 would weaken the current setup.
What the Charts Are Saying
Analysts at Elliott Wave Academy believe SOL may be forming a short-term corrective rebound. Their analysis points to a possible move toward the 50%–61.8% retracement of the previous decline, with room to extend toward the 78.6% level if buying picks up. But they caution that how price reacts near those levels will determine what comes next.
Analysts from MCO Global DE describe recent price moves as mostly “noise,” with no confirmed breakout in either direction. They place immediate support at $81.28, with a stronger support band between $71.92 and $77.96. Those zones have absorbed selling pressure during recent pullbacks. The firm also warns that another short-term dip is possible before any larger recovery attempt takes shape.
For any sustained recovery, SOL needs to clear $95 first. After that, attention would shift to the 50-week EMA near $124, which has acted as firm resistance since SOL lost it earlier this year. A close above $124 would open room toward $175 and $200.
Trading Volume Points to Active Selling
CoinMarketCap data shows SOL trading at $82.21, down 5.83% in the past 24 hours. Market cap sits at $47.51 billion. Daily trading volume rose 10.04% to $3.89 billion.
The rise in volume during a price drop is worth noting. It typically indicates active selling rather than a quiet consolidation. Resistance sits in the $90–$95 zone on the short-term chart.
The key technical barrier at $96 remains unbroken. Until buyers reclaim that level convincingly, the market structure is expected to stay neutral.
Analysts also point to $110 as a longer-term resistance zone that could define whether Solana enters a true trend reversal or stays range-bound.
SOL now trades near $82.21, with support at $80 and resistance between $90 and $95.
The post Solana (SOL) Price: The Chart Setup Every Solana Holder Needs to See Right Now appeared first on CoinCentral.


추천 콘텐츠

CFTC Officials Questioning Prediction Markets Suspended, NYT Reports

US Consumer Confidence Plunges to Historic Low as Economic Anxiety Builds
Exploring Galaxy Gas: Premium Whipped Cream Chargers for Culinary Excellence in Canada


인기 뉴스
더보기
