

S&P 500 Wins 8 Straight Weeks — But Midterm History Signals a Rough Summer
TLDR
- The S&P 500 has just posted its longest winning streak since 2023, but analysts warn of a historically weak summer ahead.
- In midterm election years, the S&P 500 has averaged a loss of 2.8% from April to September, per Dow Jones Market Data.
- Rising oil prices near $110 a barrel and a 10-year Treasury yield hitting a 12-month high of 4.61% are adding pressure.
- Chip stocks like Sandisk, Micron, and AMD have dropped between 9% and 14% over five sessions due to macro worries.
- Deutsche Bank says a sustained oil shock, contractionary data, or aggressive Fed tightening would be needed to trigger a full correction.
The S&P 500 just wrapped up eight straight weeks of gains — its best run since 2023. All three major indexes finished higher on Friday, with weekly gains across the board.
But as June approaches, some strategists are urging caution. Historically, the summer months in midterm election years have been tough on stocks.
According to Dow Jones Market Data, the S&P 500 has averaged a loss of 2.8% from the end of April through the end of September in midterm years. This year, the index is up 3.7% so far in May.
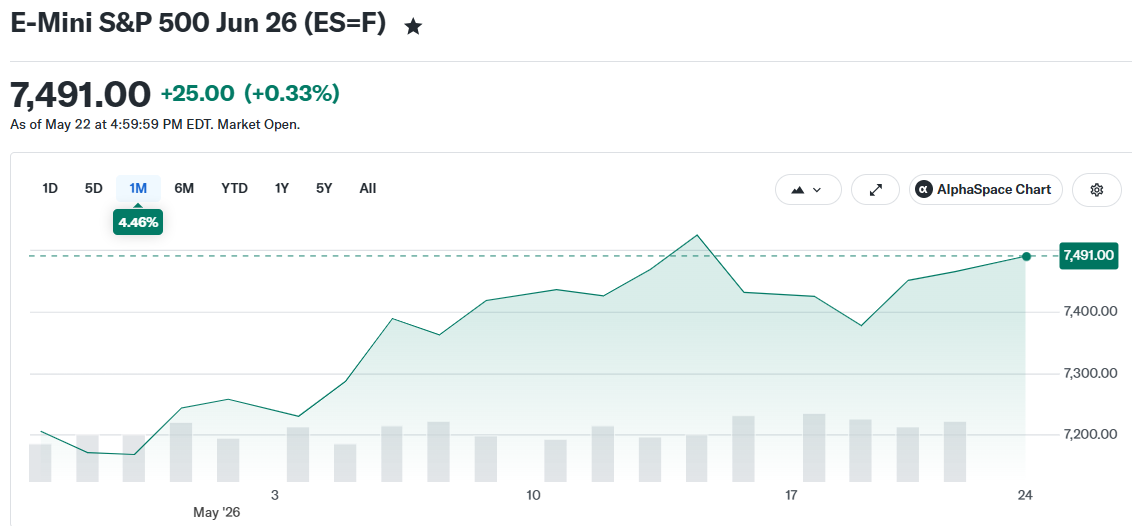 E-Mini S&P 500 Jun 26 (ES=F)
Past midterm summers have included some severe drops. The S&P 500 fell more than 25% in 1930, nearly 30% in 1974, and 24% in 2002 — all midterm years. Even removing those outliers, the average performance for the period is essentially flat, at a gain of just 0.006%.
The Cboe Volatility Index currently sits at 16.7%. Nomura strategist Charlie McElligott has flagged this as unusually high for a market in such a strong uptrend, suggesting there may be more risk beneath the surface.
Jeffrey Hirsch of the Stock Trader’s Almanac says midterm election years tend to shift investor focus away from earnings and toward political uncertainty. He does not expect a bear market but says the market could turn “sideways choppy” over the summer.
Jay Hatfield of Infrastructure Capital Advisors points to a broader seasonal pattern: markets tend to be stronger during earnings seasons and weaker after them.
Oil Prices and Rising Yields Add to the Pressure
Separately, global markets have faced downward pressure over the past two weeks due to the ongoing conflict in Iran.
Brent crude oil has surged toward $110 a barrel, driven by supply disruptions around the Strait of Hormuz. That is pushing gas prices higher ahead of the Memorial Day travel weekend.
The 10-year US Treasury yield has climbed to a fresh 12-month high of 4.61%. Higher yields make bonds more attractive compared to stocks and raise borrowing costs for companies.
The combination of sticky inflation data and rising yields has led to profit-taking in the tech and semiconductor sectors. Sandisk and Micron have each dropped around 14% over five sessions. AMD is down roughly 9% over the same period.
Deutsche Bank strategist Henry Allen said a meaningful sell-off would require at least one of three things: a sustained oil shock, clearly contractionary economic data, or aggressive central bank rate hikes. He noted that while oil prices are elevated, none of these conditions are clearly in place yet.
Still, Hatfield said there could be a silver lining. If Democrats win the House and Republicans hold the Senate, the result would be divided government. Historically, gridlock has tended to support markets by reducing the risk of major policy changes.
The post S&P 500 Wins 8 Straight Weeks — But Midterm History Signals a Rough Summer appeared first on CoinCentral.


추천 콘텐츠

CoreWeave (CRWV) Stock Surges 12% on $8.5B GPU-Backed Financing Deal — Here’s the Full Picture

OpenAI and Anthropic now sit at the center of Big Tech’s AI cloud backlog

LIST: Bayanihan initiatives amid soaring oil prices


인기 뉴스
더보기
