

ETH Bought but Still Bleeding; Hidden Sell Walls May Be Eating Every Rally
Ethereum’s on-chain signals look bullish but price keeps falling. CryptoQuant data points to hidden selling pressure absorbing every buy. Is $1,200 actually possible?
The buying is real. That part nobody disputes.
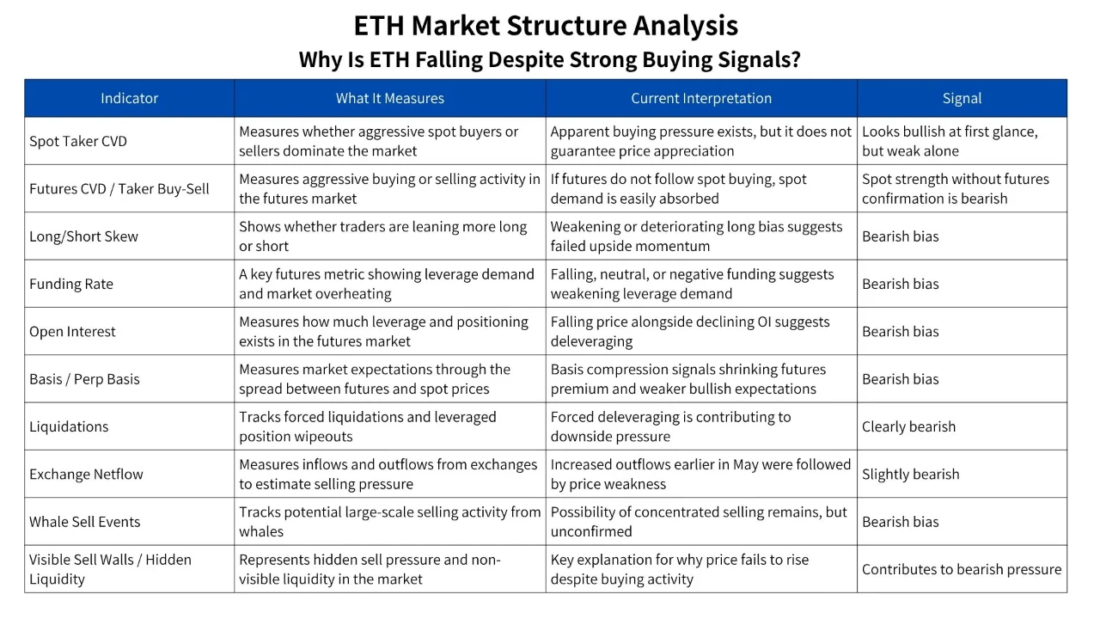
Spot Taker CVD on Ethereum stayed positive through the recent selloff. Funding Rates held above zero. Exchange Netflow showed ETH leaving exchanges at a pace that typically signals accumulation. All three pointing up. Price went the other direction anyway.
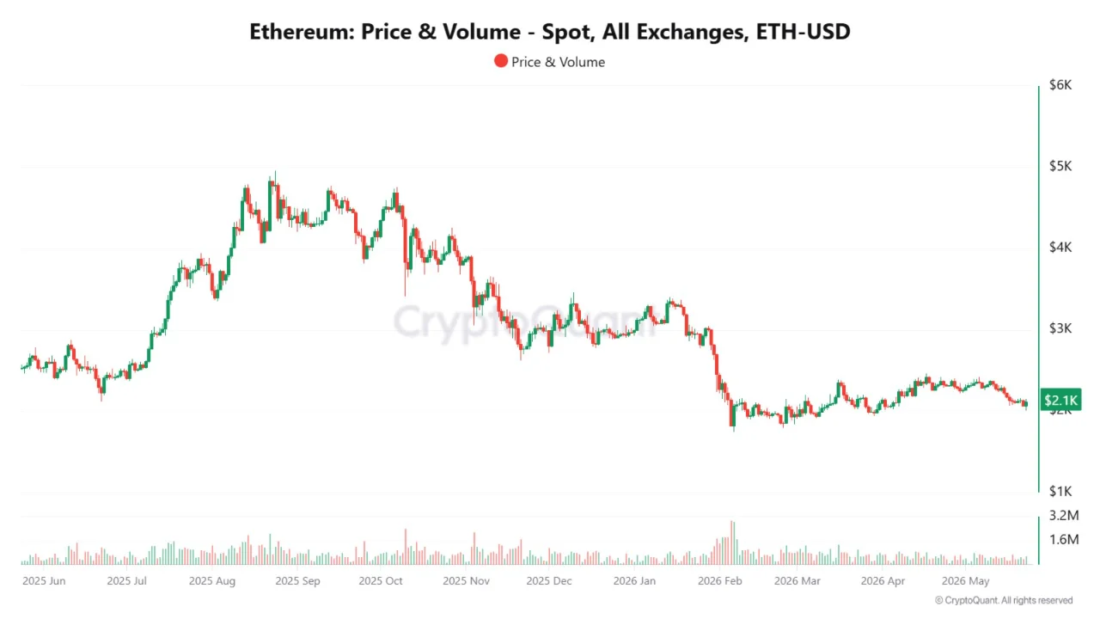
According to CryptoQuant analysts, ETH dropped from roughly $2,375 on May 11 to near $2,031 by May 23. That is not a small move. And it happened while the surface-level data was printing signals that analysts usually associate with strength.
Something Keeps Absorbing the Buys
Market makers and whales sit on the other side of the trade. Per the CryptoQuant report, large sell orders continue absorbing incoming demand even as aggressive buying picks up. It is the kind of hidden liquidity that does not show up cleanly in public orderbooks.
Source:CryptoQuant
Visible sell walls and non-visible liquidity both contribute. Basis compression in the perpetual markets tells a similar story, shrinking futures premiums alongside weakening long bias across the order book. The Long/Short Skew shifted bearish. Forced liquidations piled pressure onto an already fragile structure.
Then there is Open Interest. Rather than expanding during recent price bounces, OI declined. Per the CryptoQuant analysis, that pattern points more toward short covering and deleveraging than genuine long accumulation. A typical healthy rally does not look like this.
Brief relief came when President Trump stated the Strait of Hormuz “will be opened,” per comments made following Middle Eastern talks on Iran. Markets read it as a geopolitical thaw. Bitcoin and Ethereum both bounced. Then the inflation concerns came back and the moment passed.
The $1,200 Scenario Nobody Is Dismissing Anymore
Source:CryptoQuant
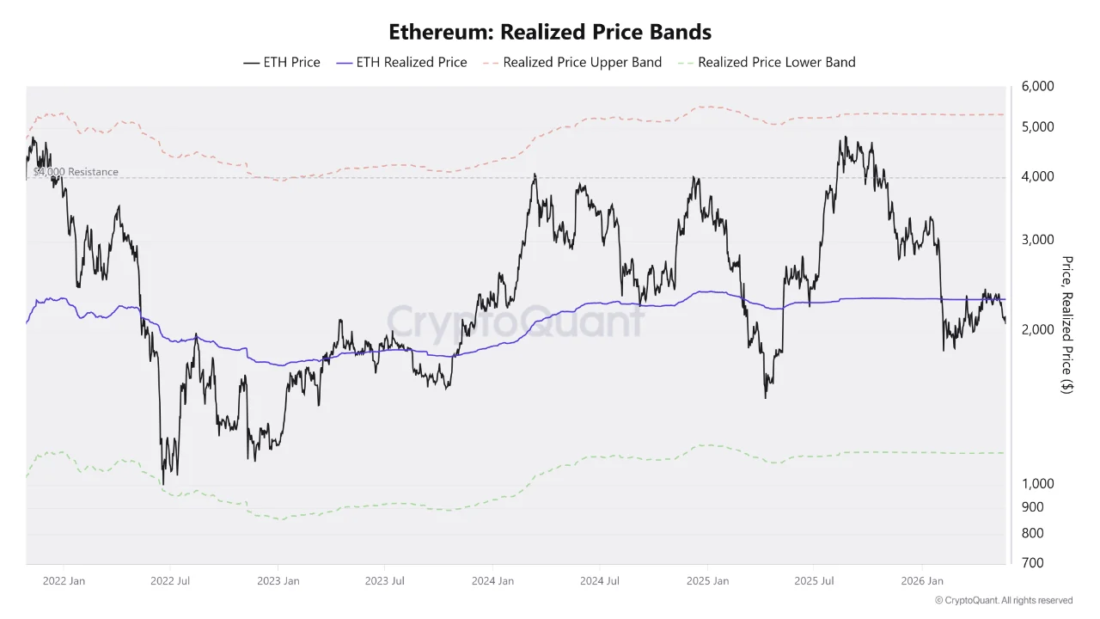
Ethereum’s realized price bands have a history worth paying attention to. A separate CryptoQuant analysis notes the lower realized price band, which marked the cycle floor during previous bear markets, currently sits at $1,154. That places it meaningfully below current price. The odds of ETH slipping under $1,200 in the coming months, the report notes bluntly, are not small.
Ethereum came close to $5,000 earlier in the cycle. It never got there. Since the slide began, ETH has spent considerable time struggling to hold $2,000, at one point breaking below $1,700.
Source:CryptoQuant
The Ethereum market structure has yet to show clean recovery signs. Technical levels near $1,984 and $1,937 are the next support zones flagged in the CryptoQuant report. If macro conditions hold steady and real spot demand builds, those levels could eventually look attractive in hindsight. That is the optimistic read.
Higher-for-longer interest rate expectations continue pressing high-beta assets. The Clarity Act gave a brief sentiment lift. Markets moved on fast. For ETH, that kind of macro environment is a structural headwind regardless of how many tokens leave exchanges.
The DeFi TVL picture adds another layer. Ethereum’s share of total value locked dropped sharply through 2026 as competing chains captured more ground, with ETH’s DeFi market share falling to around 54 percent even as total TVL held at $45.4 billion.
The buying continues. So does the falling. Per CryptoQuant, the $1,937 level is where that contradiction gets its next real test.
The post ETH Bought but Still Bleeding; Hidden Sell Walls May Be Eating Every Rally appeared first on Live Bitcoin News.


추천 콘텐츠

Buterin Pushes Back at Ethereum Foundation Critics, Reaffirms Neutrality

Fed Rate Hold in June Seen as Near Certainty, CME FedWatch Shows

‘Would be for naught!’ Right-wing hawks panic as Trump inches toward peace deal


인기 뉴스
더보기
