

Intel Stock holds 120 pivot as momentum cools near resistance
Intel Stock remains in a primary uptrend on the daily chart, but momentum has cooled near 120. Therefore, the near-term battleground sits around the daily pivot while the broader bull trend stays intact.
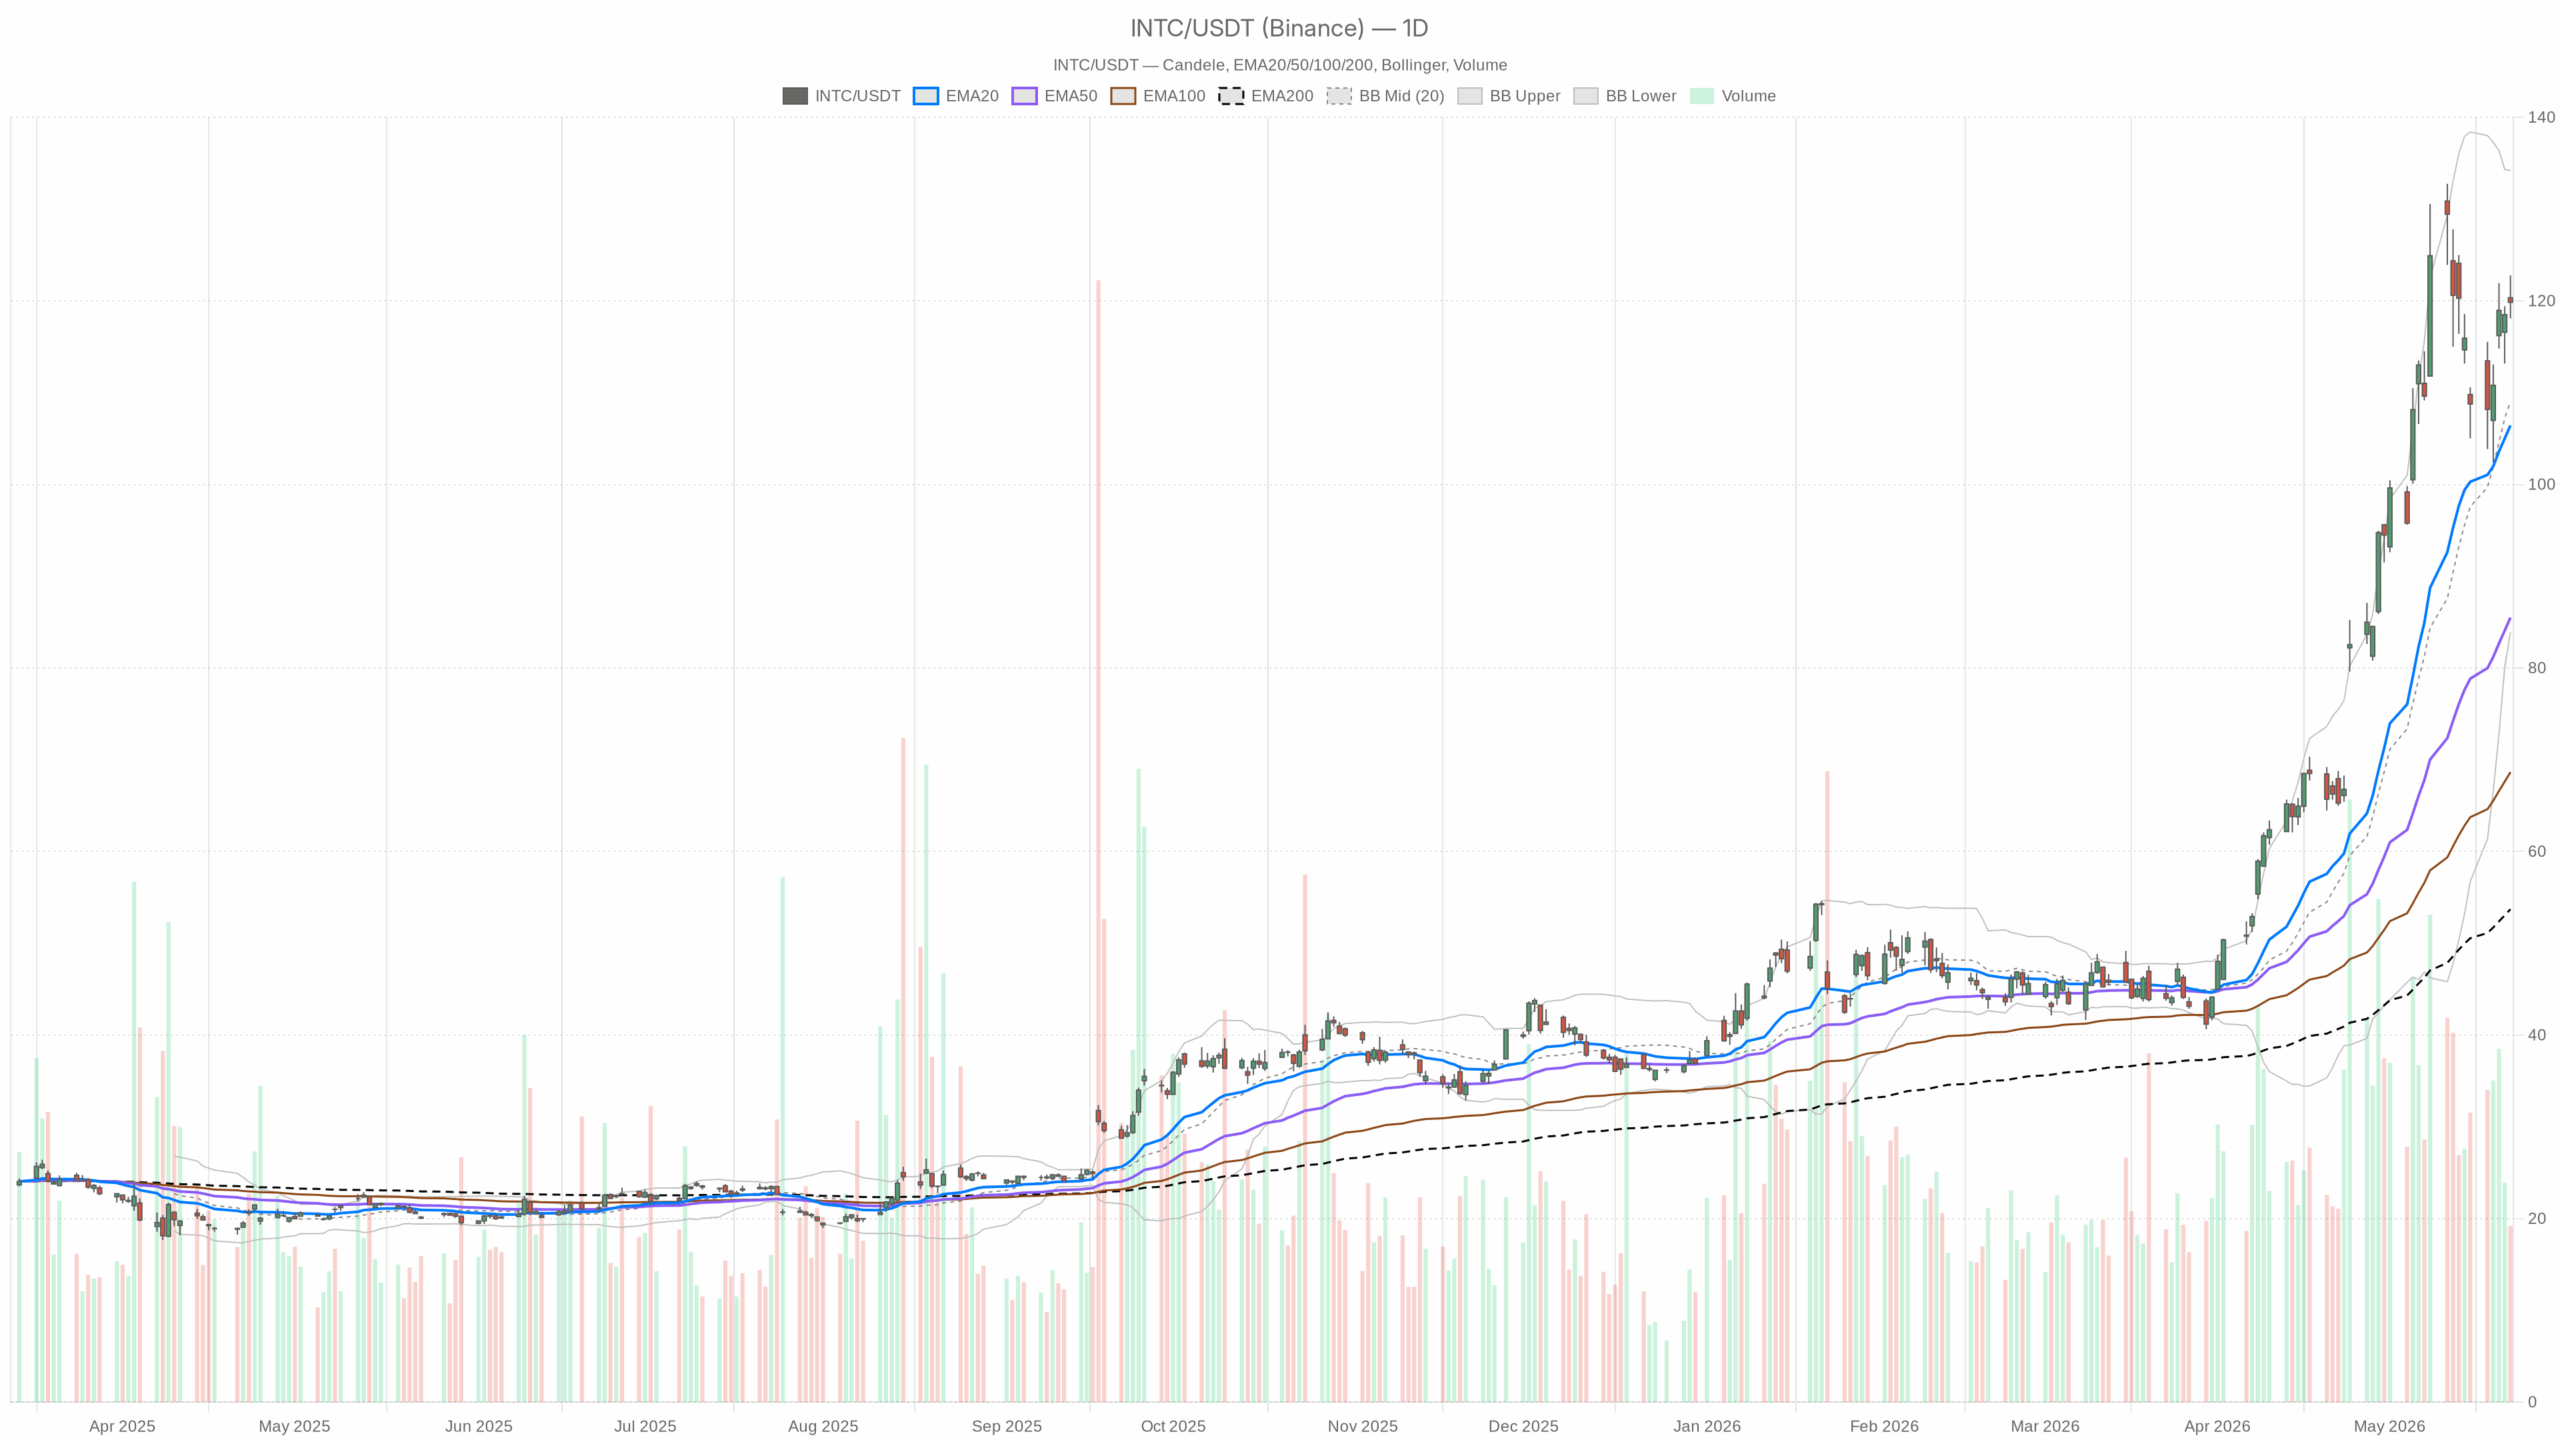 INTC — daily chart with candlesticks, EMA20/EMA50 and volume.
Daily Technical Outlook for Intel Stock
On the daily timeframe, price closed at 119.84, just below the daily pivot at 120.24. Interpretation: the market paused at a logical decision level.
The 20/50/200-day EMAs sit at 106.42, 85.48, and 53.71, all well below price. Interpretation: the trend structure is firmly bullish.
Meanwhile, the daily RSI14 reads 68.18. Interpretation: buyers still dominate, though conditions are edging toward stretched. The daily MACD histogram is -1.28 with the line below the signal. Interpretation: upside momentum has eased within the uptrend.
Notably, daily Bollinger Bands place the mid at 109.06 and the upper band near 134.20. Interpretation: price is elevated but not pressed against extremes. ATR14 is 10.16. Interpretation: volatility is high and range expansion remains a factor.
Hourly Chart: Constructive but Tempered
Meanwhile, the hourly chart supports the bullish daily bias but shows tempered follow-through. Price holds above the H1 EMA20 at 118.17 and the EMA50 at 115.63. Interpretation: the intraday trend tone is constructive.
H1 RSI14 is 57.52. Interpretation: momentum is positive but not overheated. The H1 MACD line is roughly flat versus its signal with a near-zero histogram. Interpretation: short-term impulse is indecisive.
Hourly Bollinger Bands center near 118.54 with an upper band at 122.50. Interpretation: there is room to probe higher if buyers re-engage. The H1 pivot is 119.66 with R1 120.11 and S1 119.39. Interpretation: price is hovering just above balance, so a modest push could flip the tape decisively.
15-Minute View: Minor Pullback Within Uptrend
At the same time, the 15-minute view shows a minor pullback within that backdrop. The regime is neutral, with price under the EMA20 at 120.31 but above the EMA50 at 119.23. Interpretation: micro pressure is down, yet the short-term trend is not broken.
The 15m RSI14 is 46.54. Interpretation: intraday momentum has cooled toward neutral. The 15m MACD histogram is -0.29. Interpretation: sellers have a slight near-term edge. Bollinger on 15m centers near 120.76 with the lower band at 119.50. Interpretation: price is leaning toward support rather than breakout.
Still, the 15m pivot set is PP 119.66, R1 120.11, and S1 119.39. Interpretation: execution favors buying dips into 119.39–119.66 only if reclaimed and held.
News and Competitive Context for INTC
Notably, the news tone remains supportive for the medium term. Intel is urging PC makers to adopt its latest chips to capture AI margins, which could underpin sentiment. Interpretation: a stronger product mix can sustain the bull regime if execution lands.
Meanwhile, elevated investor attention and a recent target hike to 150 underscore optimism. Interpretation: flows can stay favorable, though price still needs technical validation.
On the other hand, AMD competitive pressure in server CPUs is the key risk. Interpretation: any share-loss headlines could amplify downside moves in a high-ATR tape.
Bullish Scenario: Triggers and Targets
Therefore, the bullish path is clear but conditional. A firm reclaim and hold above the daily pivot at 120.24, followed by an hourly push through 120.11, would re-energize momentum. Interpretation: that sequence would open a run toward the daily R1 122.38, with the daily upper band at 134.20 as a distant outer marker.
If RSI stays near the high 60s without tipping into extremes and MACD stabilizes, buyers retain control. Interpretation: steady momentum alongside rising EMAs keeps pullbacks orderly.
Bearish Scenario: Supports and Risks
However, the bearish scenario emerges if price fails to hold the intraday supports and loses 119.39 on a sustained basis. Interpretation: that would put the daily S1 117.69 in play.
A daily close below 117.69 would mark a material momentum dent. Interpretation: it would shift risk toward the daily Bollinger mid at 109.06 and the EMA20 at 106.42 as deeper supports. If the daily RSI rolls over from 68 and the MACD histogram expands negatively, downside pressure likely persists. Interpretation: the uptrend would enter a corrective phase rather than a simple pause.
Positioning and Volatility for the Intel Stock Price
Overall, the daily uptrend is intact, the hourly tape is constructive, and the 15-minute picture is a manageable dip. Interpretation: alignment is bullish with a short-term hesitation. For positioning, the focus is on the 119.39–120.24 band as the near-term pivot zone. Interpretation: resolution there likely dictates whether the Intel stock price breaks higher or consolidates.
In contrast, volatility remains elevated with a daily ATR of 10.16. Consequently, the Intel share price can traverse multi-dollar ranges quickly. Expect two-way trade into resistance and around news on AI PCs and competitive dynamics. Therefore, the Intel stock price today sits near decision levels, so follow-through, not headlines alone, should confirm the next leg.


추천 콘텐츠

Globalstar (GSAT) Stock Jumps 15% Amid Amazon Takeover Discussions

CLARITY Act Clock Ticks Down: TD Cowen Says 2026 Passage Looks Less Likely–Here’s Why

SharpLink Gaming Joins Russell Indexes as Ethereum Treasury Strategy Gains Traction


인기 뉴스
더보기
