

Ferrari RACE turns cautious after EV selloff as oversold bounce nears

Ferrari RACE remains under pressure after the Luce EV unveiling. The daily setup tilts bearish below key moving averages. Intraday readings look oversold, so a reflex bounce is possible; however, nearby resistance is meaningful and close.
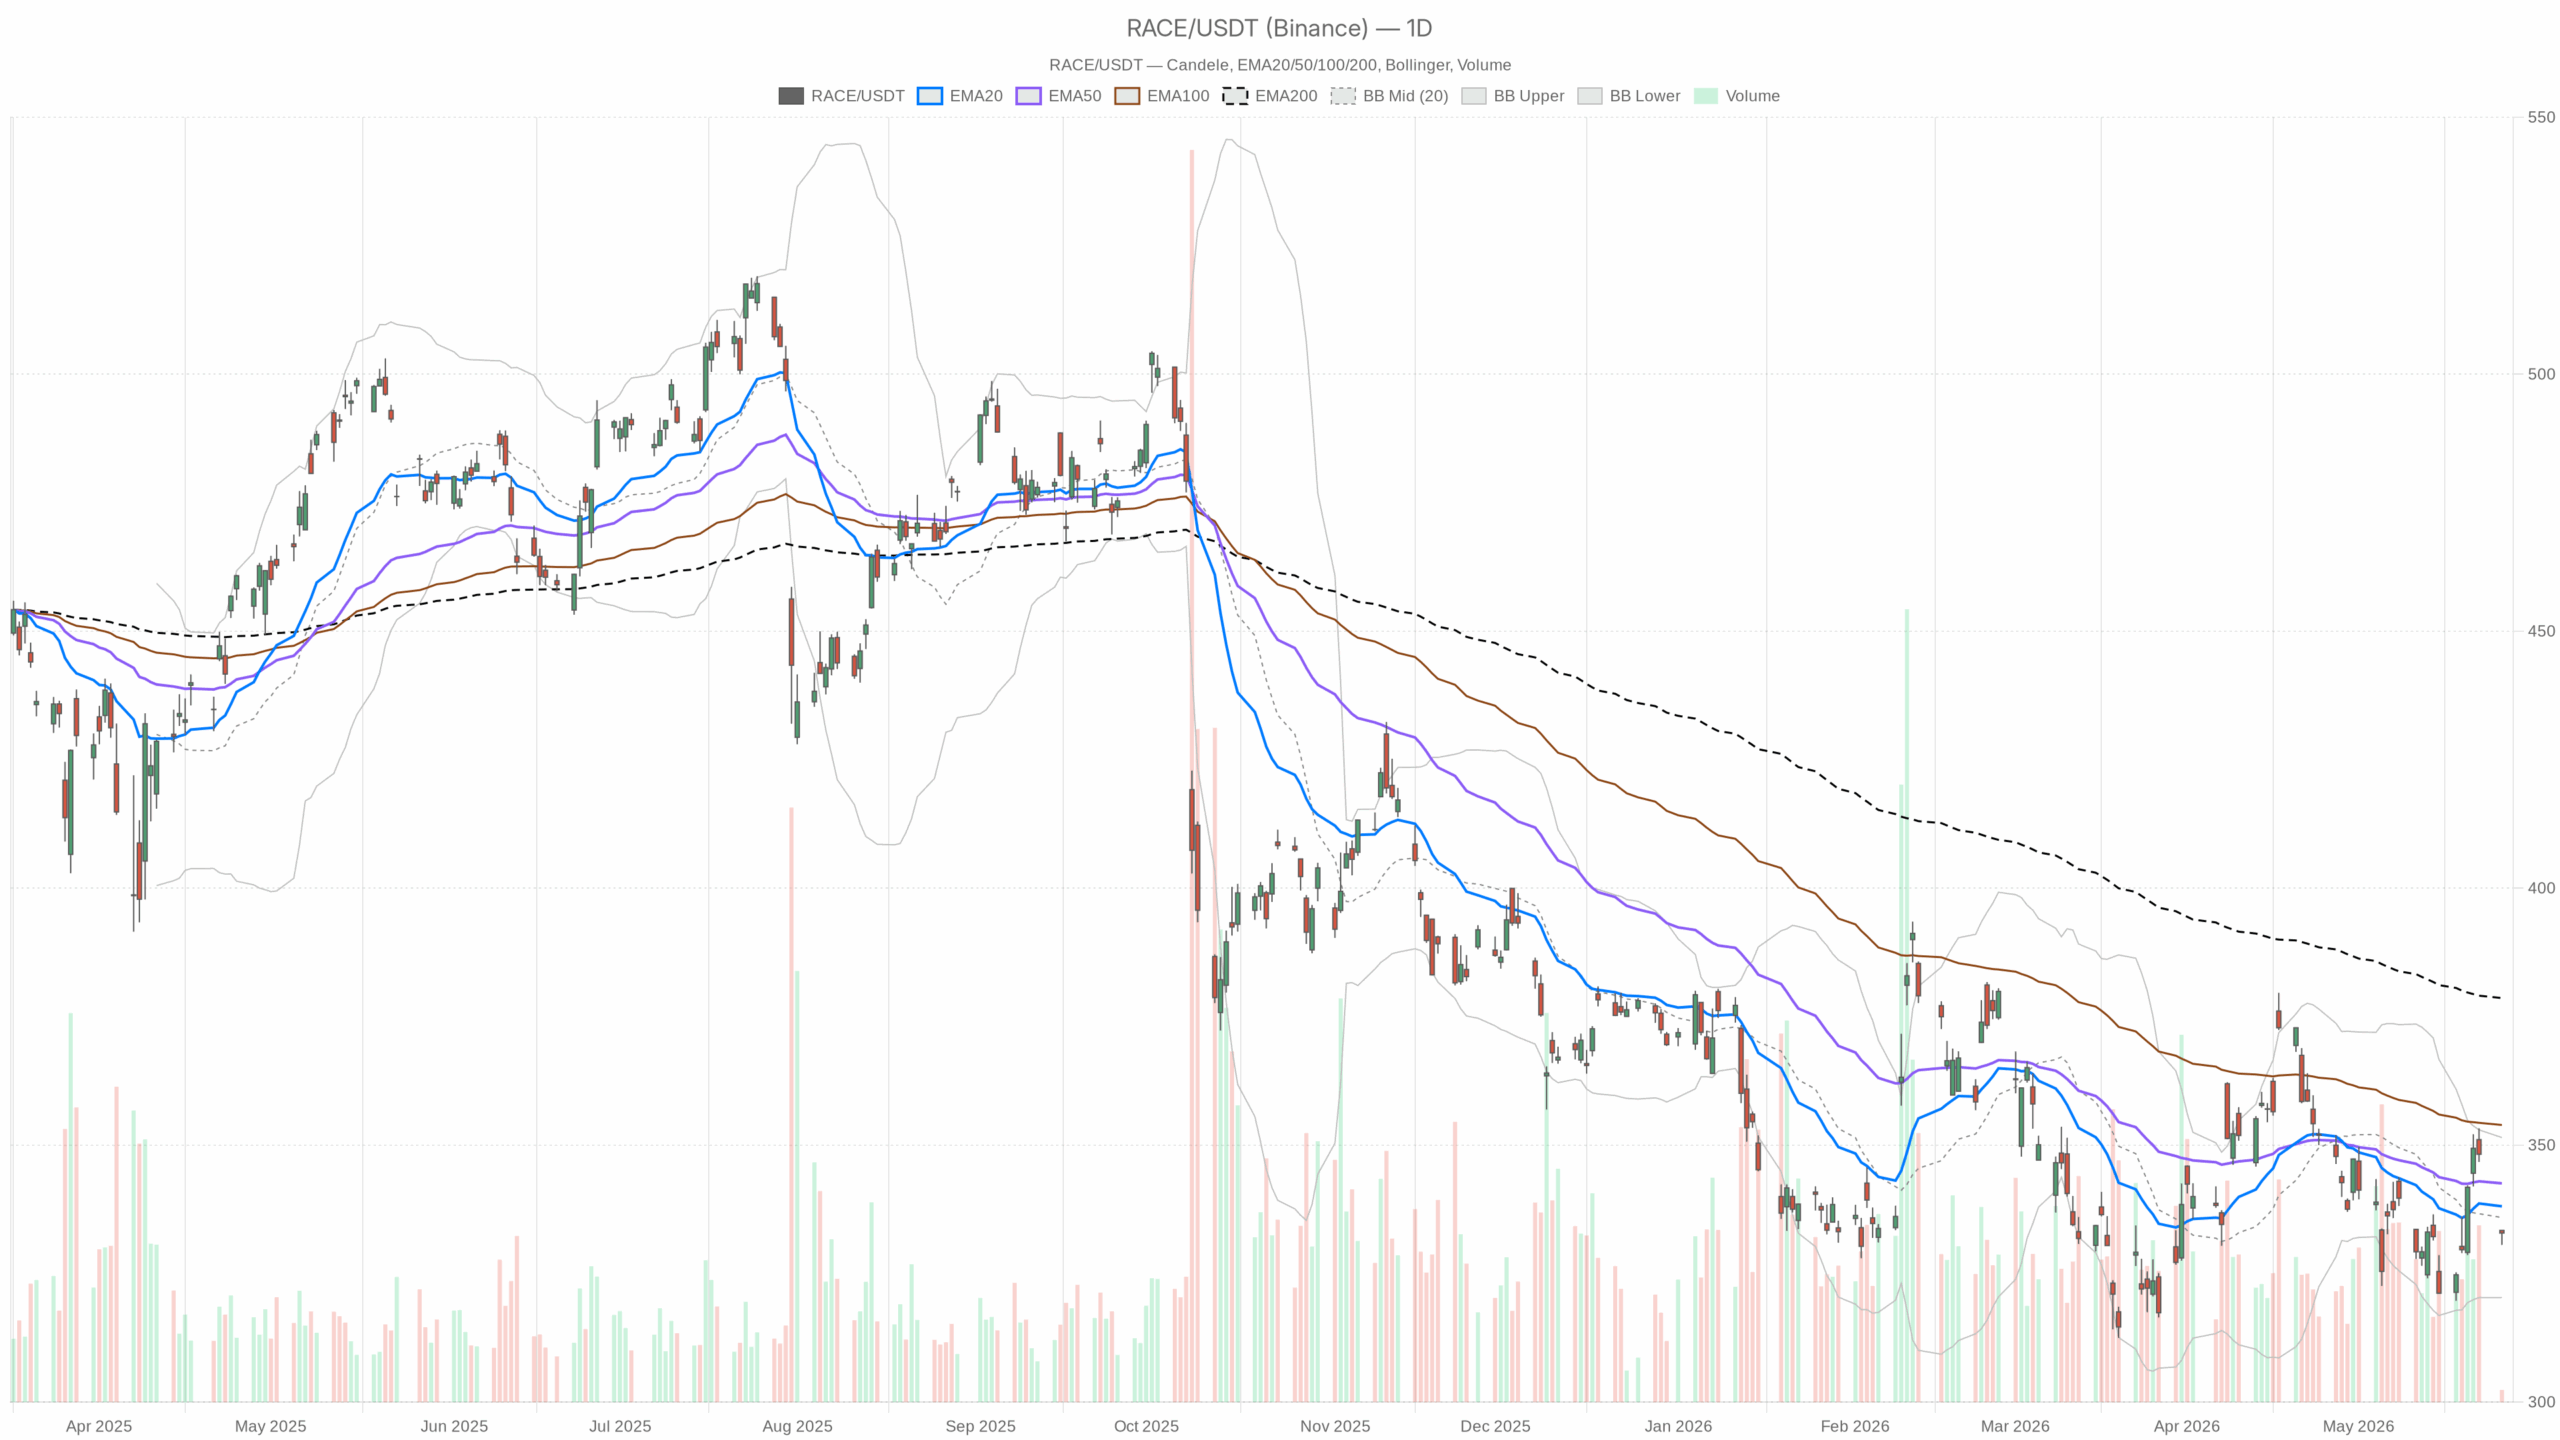 RACE — daily chart with candlesticks, EMA20/EMA50 and volume.
Ferrari RACE Daily Technical Overview
Trend posture and momentum
Price closed at 332.90, below the 20‑day EMA 338.10 and the 50‑day EMA 342.57. Trend momentum remains weak under these reference lines. The 200‑day EMA 378.63 sits well above, signalling the longer‑term uptrend has lost traction here.
Daily RSI(14) 46.16 remains sub‑50, showing buyers lack control. Daily MACD line −1.81 vs signal −3.07 with a +1.26 histogram suggests downside pressure is easing. Yet momentum has not turned decisively higher.
Volatility, bands, and pivot map
Notably, daily Bollinger Bands show a mid‑band at 335.92 with bands at 351.47/320.36. Price sits just under the mid‑band, implying neutrality that tilts soft. Meanwhile, ATR(14) 9.52 highlights elevated volatility, so ranges can expand.
The daily pivot stands at 332.33, with R1 334.07 and S1 331.15. Price is hovering at the pivot; therefore, the next impulse around R1 or S1 likely sets the session tone.
Headlines and context for Ferrari RACE
Headlines frame the weakness. Shares skidded after the first fully electric Ferrari, the Luce, was revealed. At the same time, a periodic update confirms continued buybacks under the €250 million program, which can add a floor. Earlier in May, shares jumped on a Q1 organic growth beat, yet the tape is recalibrating around the EV story.
Intraday view: 1‑hour trend remains heavy
In contrast, the 1‑hour chart does not yet support a turn. Price trades below the 20‑hour EMA 344.18, the 50‑hour 339.16, and the 200‑hour 339.00, keeping the intraday trend down.
Hourly RSI(14) 34.64 is weak, with risk of further drift if buyers do not step in. Meanwhile, the MACD line 2.76 vs signal 4.35 with a −1.59 histogram marks a bearish cross‑down in momentum.
Bollinger mid on H1 sits at 345.91, and price remains far beneath the mean, reflecting persistent pressure. With ATR(14) 3.71, expect choppy, tradable swings inside a broader down‑bias.
Very short term: 15‑minute oversold with layered resistance
At the same time, the 15‑minute context looks stretched and may produce a reflex bounce. RSI(14) 14.87 is deeply oversold, a zone where snapbacks often start. The 15‑minute MACD line −2.40 vs signal −0.63 with a −1.77 histogram keeps momentum negative. The very short term remains weak.
Bollinger mid is near 347.45 with a lower band at 337.64, while price trades around 332.90. Price sits outside the lower band, a sign of short‑term exhaustion.
However, many layers of resistance cap any bounce. The EMA20/EMA50 cluster around 346, and the EMA200 sits near 338.67. The intraday pivot is 332.92, with R1 333.46 and S1 332.35 — useful micro levels for timing and risk.
Scenarios for Ferrari RACE: bearish bias with stabilization risk
Therefore, the main daily scenario remains bearish with stabilization risk. Ferrari RACE still trades below the 20/50‑day EMAs, while RSI sits below 50 and the MACD line remains negative. A positive histogram signals slowing downside, so rallies can occur, yet nearby resistance is close.
A daily close back above the pivot and R1 (332.33/334.07) would be a first step. It would confirm demand at the session baseline. A push through the daily mid‑band at 335.92 would help. Then the 20‑day EMA 338.10 — the first trend trigger — would strengthen the case. Follow‑through toward the 50‑day EMA 342.57 adds validation. Daily RSI back above 50 and the MACD line curling toward zero would confirm improving momentum.
On the other hand, if sellers press below S1 331.15 and hold, the path of least resistance reopens lower. With daily ATR 9.52, a break can accelerate toward the lower Bollinger area near 320.36. Volatility would likely expand. Hourly RSI staying sub‑40 and a persistently negative H1 MACD histogram would corroborate pressure. The bullish case weakens on fresh lows without swift recovery, especially if bounces stall beneath 334–338.
Bottom line and risk management
Overall, positioning should respect elevated volatility and the mixed backdrop. The EV launch injects uncertainty. The ongoing buyback offers partial support. The daily trend still sits below key averages.
Short‑term bounces are possible from oversold 15‑minute conditions, but buyers must reclaim 335.92 then 338.10 to change the narrative. Until that occurs, rallies face supply. Risk management can lean on the stated pivots and ATR‑scaled ranges to size exposures and time entries in Ferrari RACE.


추천 콘텐츠

Why Cathie Wood Thinks Bitcoin Will Reach $1.25 Million

Luxor Ships Commander Software to Optimize Bitcoin Mining Fleet Profitability – News Bytes Bitcoin News

Vodacom Tanzania Modernises M-Pesa With $28m Infrastructure Upgrade


인기 뉴스
더보기
