

Why is Crypto Down Today? May 28
TLDR
- Bitcoin dropped below $73,000 after U.S. airstrikes on an Iranian military site near the Strait of Hormuz.
- Nearly $1 billion in crypto leveraged positions were liquidated in 24 hours, with 93–94% coming from long positions.
- BlackRock’s Bitcoin ETF saw $527.8 million in outflows, part of $733.4 million in total Bitcoin spot ETF outflows on May 27.
- Ondo fell over 11% on the day, deepening a 25% slide from its May 22 peak.
- The total crypto market cap dropped 1.66% to $2.43 trillion, shedding over $40 billion.
U.S. airstrikes on Iran sent shockwaves through global markets Thursday, with Bitcoin taking one of its sharpest single-day drops in months. The combination of geopolitical tension and heavy institutional selling pushed the broader crypto market to a critical technical level.
Bitcoin Falls Hard as Middle East Tensions Flare
Bitcoin traded at around $72,978 in Asian hours on Thursday. That marked a 3.4% drop over 24 hours and a 6.3% slide over the past seven days.
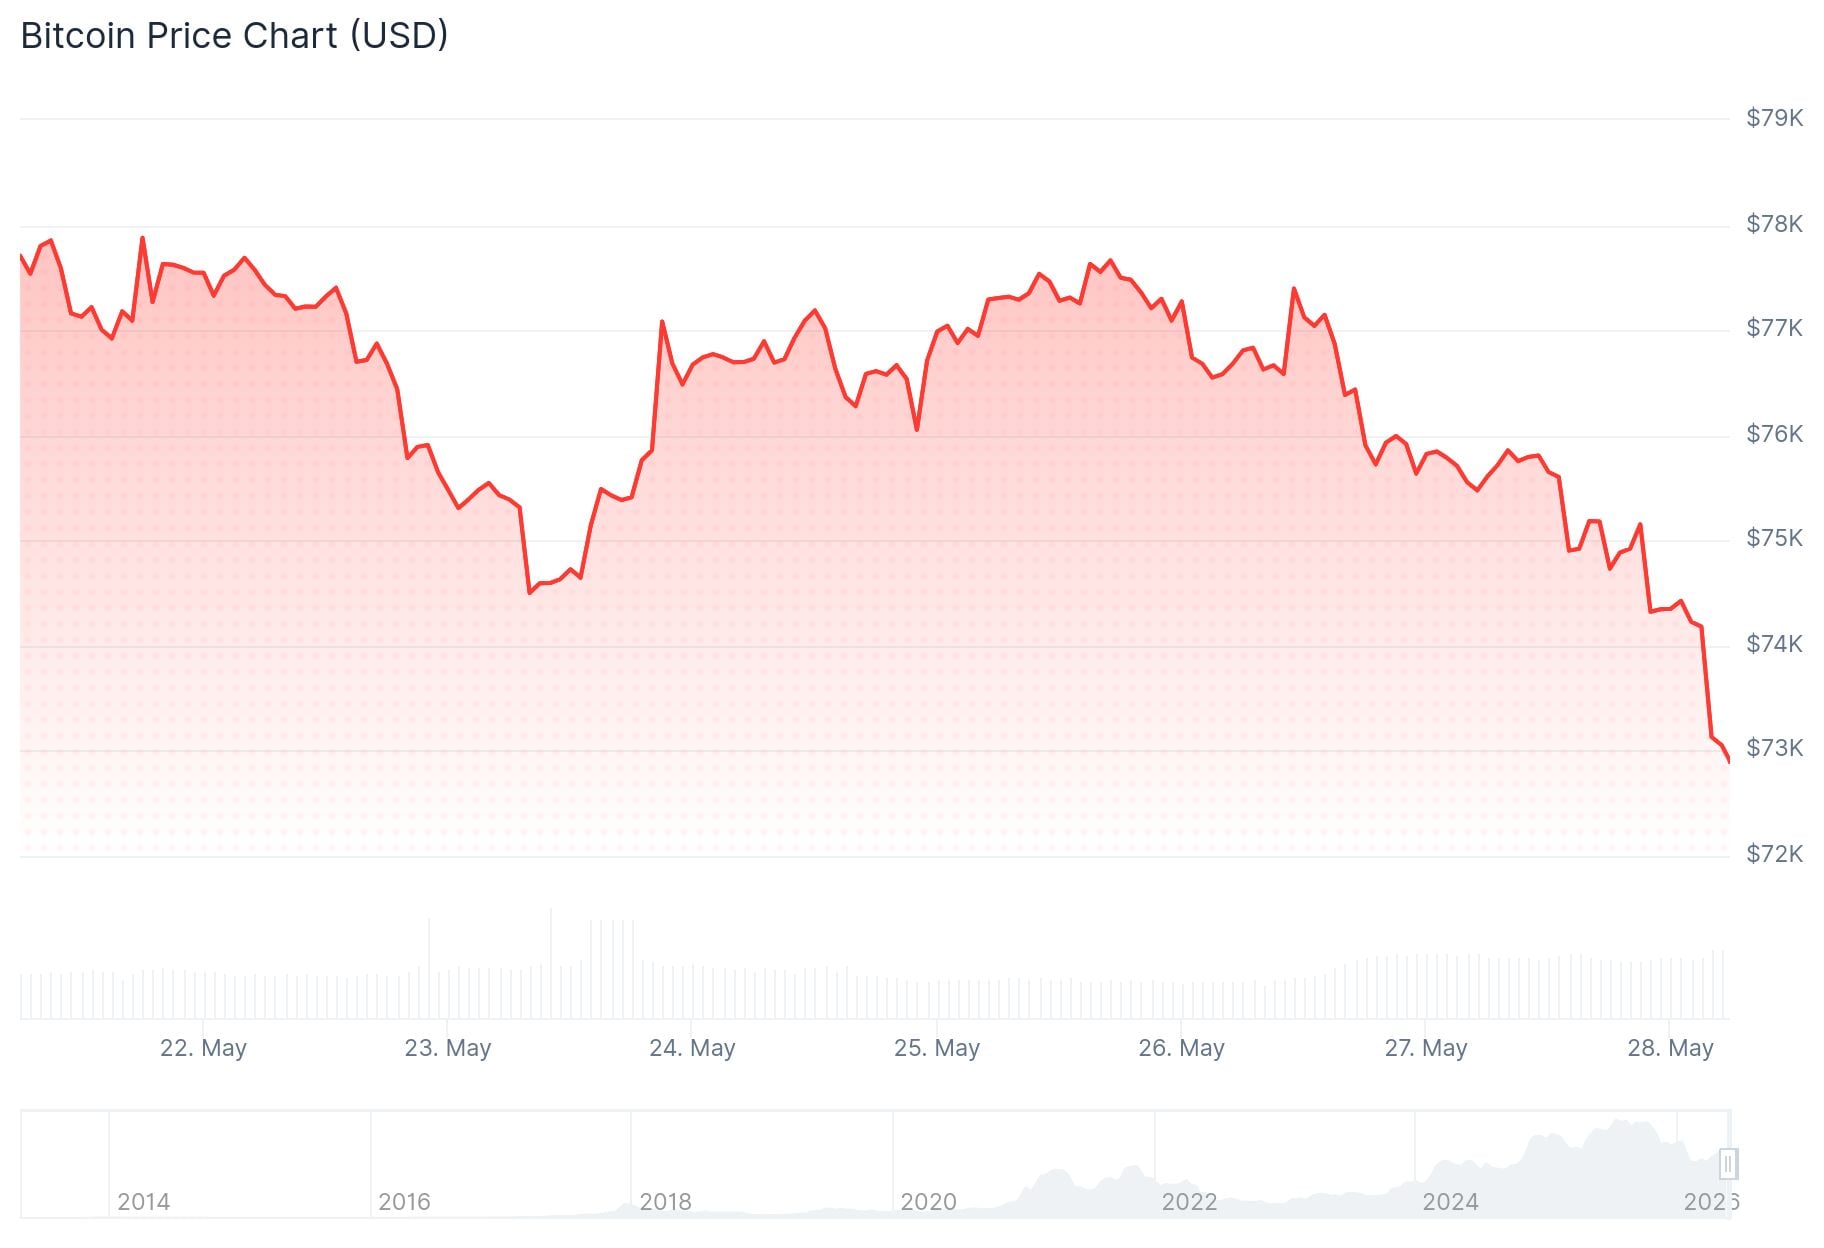 Bitcoin (BTC) Price
The trigger was a U.S. Central Command airstrike on an Iranian military site near the Strait of Hormuz. American forces also shot down four Iranian attack drones fired at a commercial ship. A U.S. official described the action as defensive and aimed at maintaining a ceasefire that began last month.
Iran responded by targeting the airbase the strikes came from, according to reports citing the Islamic Revolutionary Guard Corps. Kuwait also said it was responding to hostile missile and drone threats in the region.
The news reversed ceasefire optimism that had been building in markets for weeks. Bitcoin had held above $74,000 through several earlier Iran headlines. Thursday’s strikes broke that floor.
Ethereum fell 4.2% to $1,976, dropping below the $2,000 mark. Solana dropped 3.5% to $80.57, XRP fell 3.6% to $1.28, and Dogecoin lost 3.2% to $0.0979. Hyperliquid was the only major token to hold a weekly gain, though it still fell 4.5% on the day.
ETF Outflows Added Selling Pressure
Institutional selling compounded the damage. Bitcoin spot ETFs recorded net outflows of $733.4 million on May 27. BlackRock’s fund alone saw $527.8 million leave in a single day.
That selling fed directly into the liquidation cascade. Bitcoin accounted for $386 million of the forced exits, followed by Ethereum at $246 million. The largest single liquidation was a $15.34 million Bitcoin position on Hyperliquid.
 Source: Coinglass
CoinGlass data shows $958.8 million in total liquidations across 167,706 traders over 24 hours. Around 93% of those were long positions — traders who had bet on prices rising.
Altcoins and Market Structure
The total crypto market cap fell 1.66% to $2.43 trillion, shedding around $40.91 billion. That puts the market at the 0.618 Fibonacci retracement level of the rally from late March to the May high of $2.72 trillion.
Ondo was among the hardest hit tokens, falling over 11% on the day. That extended a 25% decline from its May 22 peak of $0.47.
On the Bitcoin chart, prices sat between the 0.5 Fibonacci level at $73,871 — which it had already lost — and the 0.618 level at $71,765. Selling volume on the most recent red candles dropped compared to earlier in the slide, a sign that downside pressure may be easing near that level.
A daily close below $71,765 would open the door to the $68,766 zone. A recovery above $75,978 would reopen the path toward $78,584.
The speed of the liquidation cascade on Thursday suggests traders were caught positioned for a recovery when the market moved the other way.
The post Why is Crypto Down Today? May 28 appeared first on CoinCentral.


추천 콘텐츠

Bitcoin Perpetual Futures Long/Short Ratios Signal Cautious Market Sentiment

Cash App Rolls Out USDC Stablecoin Support Across Four Major Blockchains

Stable Token Jumps 24.6% as Market Cap Crosses $771M: What’s Driving Volume?


인기 뉴스
더보기
