

Bitcoin Could Face Deeper Pullback as $150B Treasury Liquidity Operation Nears
Between May 28 and June 5, the U.S. Treasury is executing a series of bill and coupon settlements totaling approximately $150 billion – a concentrated liquidity drain that Mott Capital Management founder Michael Kramer argues could push Bitcoin significantly lower from its current levels near $73,000. The schedule breaks down as $15 billion in T-bills settling Thursday, $47 billion in coupon settlements Friday, $68 billion on Monday, $16 billion in T-bill settlements Tuesday, and a final $5–15 billion T-bill settlement on June 4.
The mechanism is straightforward and consequential: when the Treasury sells new securities, cash from investors moves into the Treasury’s account at the Federal Reserve, pulling reserves out of the banking system and reducing the pool of capital available for risk assets. Bitcoin, already down 11% from its recent high above $82,500 and trading near $73,000 at press time, has broken the $75,000 support level that had held through the prior month – a price structure signal Kramer reads as confirmation that liquidity conditions are already tightening ahead of the heaviest settlement days.
The open question the market must now resolve is whether this $150 billion drain represents a temporary technical headwind that Bitcoin absorbs at current levels, or the trigger for a deeper structural pullback that removes the demand floor the asset has relied on since the February lows.
Treasury Liquidity Operations: How the Plumbing Actually Drains Risk Markets
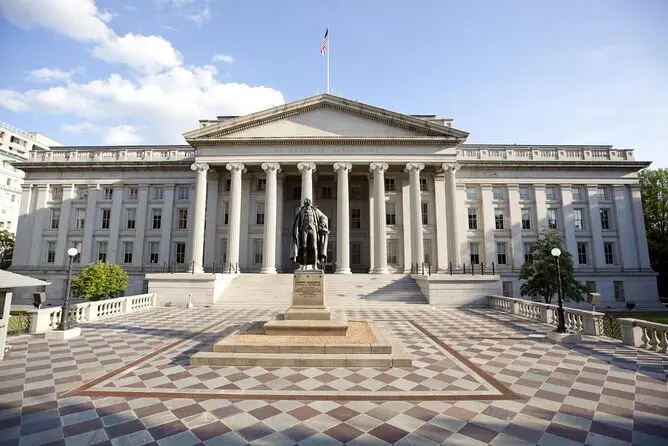
The Treasury General Account functions as the government’s operating checking account at the Federal Reserve. When Treasury auctions new bills or bonds and settles those securities, investor cash moves from commercial bank reserves into the TGA – directly shrinking the monetary base available to financial markets. For risk assets, the effect is analogous to a margin call on the system: less liquidity, higher funding costs, reduced appetite for high-volatility positions.
This dynamic has been measurable and recurring. In August 2025, Coinbase analyst David Duong estimated a planned TGA rebuild of approximately $400 billion was the primary driver of bitcoin’s trend loss and broader risk-asset weakness that summer – arguing Fed narrative events like Jackson Hole were “just excuses” compared to the liquidity shock. A subsequent cycle saw the TGA climb roughly $200 billion to $965 billion by late October 2025, coinciding with a 36% bitcoin drawdown from its then-all-time high of $126,210 and a crash to $81,000 on January 30 that Arthur Hayes explicitly tied to that liquidity extraction.
What makes the current episode structurally different from prior cycles is the near-depletion of the reverse repo facility, which once served as a liquidity buffer absorbing Treasury issuance without hitting bank reserves directly. That buffer has shrunk from over $2 trillion to under $50 billion, meaning there are fewer shock absorbers left in the system. As Kramer states plainly: “In my experience, Bitcoin tends to be a better liquidity indicator than most other instruments. If the Treasury settlements are a drain on liquidity, then Bitcoin could be heading much lower.” The $150 billion drain, while smaller than the August 2025 episode, arrives with the system running on thinner margins – amplifying the per-dollar impact on risk assets including crypto.
An additional transmission channel now operates through stablecoin issuers, which collectively hold over $120 billion in Treasuries. Aggressive issuance and settlement cycles can force redemptions, shrinking stablecoin supply and tightening crypto-native liquidity in ways that compound the macro-level drain.
Bitcoin Price Structure: The Levels That Define What Happens Next
Bitcoin is currently trading near $73,000, operating below what had been a firm support band between $75,000 and $76,800 – a zone that held through multiple tests in March and April. The breakdown of that level is not merely technical: on-chain cost basis data places a large cluster of short-term holders in the $76,000–$80,000 range, meaning a significant portion of recent buyers are now underwater and represent potential capitulation supply rather than a demand floor.
 Photo by George Morina on Pexels
K33 Research has identified $83,000 as the breakeven level for many spot Bitcoin ETF holders – a threshold that now sits roughly 14% above current price. Sustained trading below that level historically prolongs institutional outflows, as ETF managers face redemption pressure from clients unwilling to hold losing positions through macro uncertainty. Recent Bitcoin ETF outflows approaching $1.26 billion confirm that institutional de-risking is already underway heading into the settlement window.
The immediate support level to watch is $70,000 – a round-number psychological floor with on-chain significance as a cost basis cluster for longer-term holders. Below that, the next meaningful demand zone sits between $65,000 and $67,000, corresponding to the consolidation range from late 2024. The upside trigger that invalidates the bearish scenario is a clean reclaim of $75,000 with volume, which would signal that the liquidity drain was absorbed without structural demand destruction. The macro event most likely to resolve the scenario in either direction is the final heavy settlement day on Monday, when $68 billion in net new Treasury cash moves out of the banking system in a single session.
Why This Liquidity Event Adds to Existing Headwinds, Not Replaces Them
The Treasury operation does not arrive in a vacuum. Bitcoin has been contending with sustained ETF outflows, a risk-off shift in institutional positioning, and a stronger dollar – each of which independently pressures the asset, and which collectively reduce the bid depth available to absorb a liquidity shock of this scale.
Ether’s price action adds context: ETH has fallen below $2,000 for the first time since March, down nearly 8% over the past week, while ether futures open interest has hit a record high of 16 million ETH even as prices decline. That combination – rising open interest against falling prices – indicates aggressive leveraged short positioning, a sign that sophisticated traders are already positioned for further downside rather than buying the dip. When ether futures markets lean this heavily bearish heading into a liquidity-drain event, history suggests the crypto complex as a whole is more vulnerable to a cascade than a quick recovery.

Macro analysts tracking combined Fed balance sheet, TGA, and reverse repo flows estimate that a $500–600 billion Treasury cash rebuild over two to four months can cap bitcoin for an entire quarter. The current $150 billion operation is a single concentrated episode within what may be a larger seasonal rebuild – making the TBAC quarterly refunding calendar and upcoming Treasury Borrowing Advisory Committee guidance the critical data to watch beyond the immediate settlement window.
The bull scenario requires Bitcoin to hold above $70,000 through the June 4–5 final settlements while ETF flow data stabilizes – any net inflow day during the drain window would signal that institutional demand is absorbing the shock. The bear scenario is confirmed by a daily close below $70,000 on elevated volume, particularly if Monday’s $68 billion settlement triggers a visible selloff in equity futures that spills into crypto within the same session. The next major macro data point that could shift the calculus in either direction is the June FOMC meeting date, where any dovish signal on balance sheet policy would reduce the implied severity of future TGA refills.
The post Bitcoin Could Face Deeper Pullback as $150B Treasury Liquidity Operation Nears appeared first on icobench.com.


추천 콘텐츠

Trezor Enables USDT and USDC Yield Via Morpho
Trump's scheme backfiring spectacularly as his approval rating just hit rock bottom

Stablecoin News: Cash App Turns USDC Into Mainstream Digital Money


인기 뉴스
더보기
