

Stellar (XLM) Lights Up the Charts With a 16% Gain: Breakout or Bull Trap?
- Stellar has surged by over 16% gain in value.
- XLM’s broader trend is moving higher.
The Crypto Fear and Greed Index value is settled at 25, suggesting fear sentiment in the market. Among the digital assets, Stellar (XLM) secures a spot among the trending coins with a 16.28% gain in value. According to CoinMarketCap data, it currently trades within the $0.2212 zone.
In addition, Stellar’s market cap is found at $7.3 billion, with its daily trading volume having skyrocketed by over 480.33%, resting at $1.01 billion. The Coinglass data has reported that the market has seen $2.03 million worth of Stellar liquidation in the last 24 hours.
Looking at the 24-hour price chart, the XLM price has bottomed at the $0.1888 mark in the morning hours. Later, with a potential bullish move, the price has tested certain crucial levels and gradually climbed to a high of $0.233.
If the bulls strengthen their position, the Stellar price would go up to the resistance at $0.23. Upon breaking this range, it might continue to climb, and the golden cross could take place, sending the price even higher. Assuming the bears re-enter the XLM market, the price might slip and test the $0.21 support. Failing to hold this price range could drive the price even lower with the emergence of the death cross.
Will Stellar Be Able to Sustain Its Upward Bullish Trajectory?
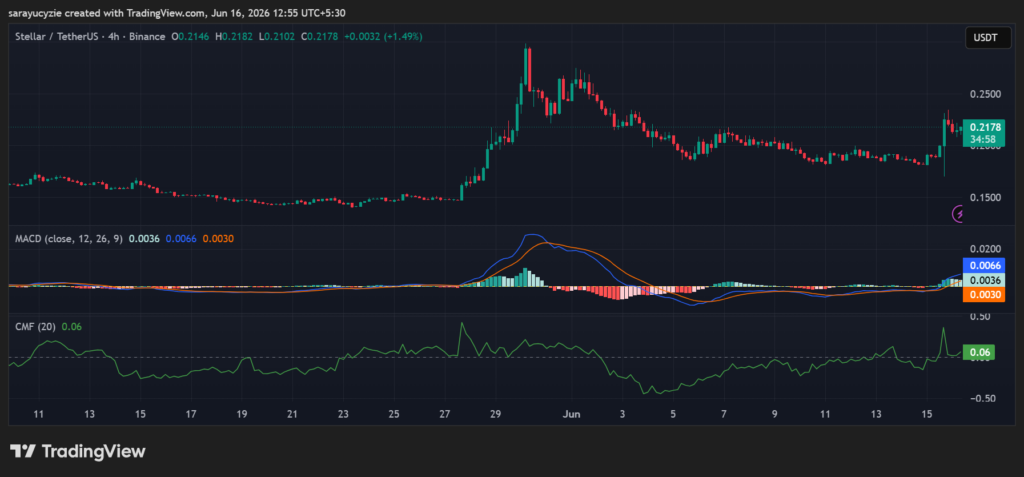
Both the signal line and the Moving Average Convergence Divergence (MACD) line are above the zero line. It indicates a strong bullish trend with positive momentum. This setup suggests that the buying pressure remains stronger than the selling pressure, and the broader trend is moving higher, with XLM bulls in control.
 (Source: TradingView)
Besides, the Chaikin Money Flow (CMF) indicator reading of 0.06 indicates modest buying pressure. The money is flowing into the asset rather than out of it. Also, it is not high enough to signal aggressive accumulation. Its steady buyer interest is supporting a mildly bullish outlook as long as the value remains in positive territory.
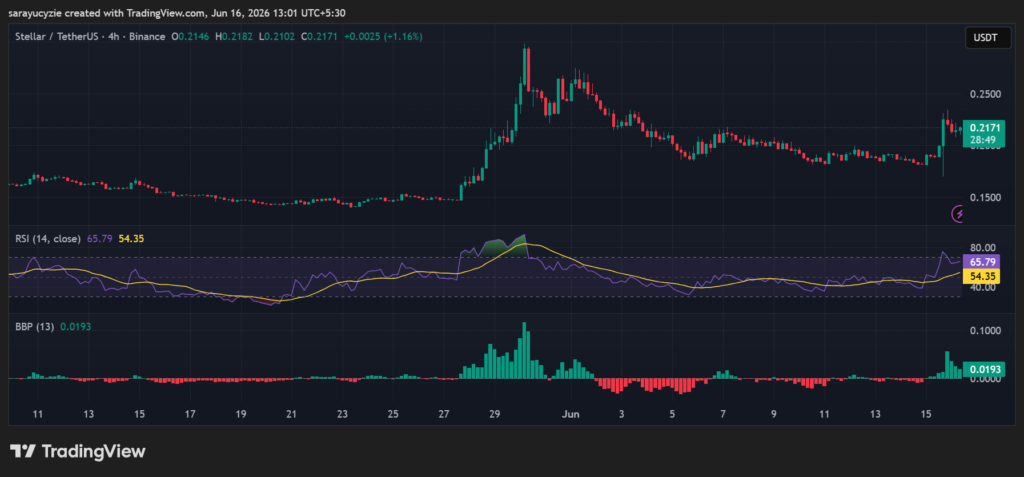
Stellar’s Relative Strength Index (RSI) is positioned at 65.79 infers a strong bullish momentum. It is exhibiting consistent purchasing activity as it is trading above the neutral level. It has not yet reached a level that indicates fatigue, even if it is very close to the overbought zone at 70.
 (Source: TradingView)
Additionally, a minor bullish advantage is shown by the Bull-Bear Power (BBP) value of 0.0193, although the strength is still restricted. However, the reading is relatively low and does not suggest strong momentum or aggressive buying. This level of reading is seen in a consolidating market.
Crypto Market Highlights
Seized Alameda Funds on the Move Again: What Could the Latest US Government Transfer Signal?


추천 콘텐츠

Hyperliquid, Uniswap and Worldcoin buck crypto slump as traders chase AI, DeFi trends

Crypto PAC Stakes $12M in Alabama Senate Runoff Ahead of Voting

Silver Price Forecast: XAG/USD Holds Key Support as All Eyes Turn to Fed Decision


인기 뉴스
더보기
