

Bitcoin Price Bottom Signal Flashes as 43-Month Metric Hits Low

Key Insights
- Bitcoin price bottom signals strengthened as realized losses reached extreme levels.
- BTC crypto demand improved after institutional fund withdrawals finally reversed.
- The price of Bitcoin faced a test after two losing quarters.
Bitcoin price bottom signals strengthened after an on-chain loss gauge reached its weakest reading in nearly four years. The deterioration came as BTC crypto markets attempted to stabilize following a deep drawdown.
The price of Bitcoin had fallen sharply from its October peak before buyers returned cautiously. That recovery gained attention because institutional flows improved while network cost-basis data approached historically sensitive zones.
Bitcoin Price Loss Gauge Hits Extreme Zone
CryptoQuant data showed the realized profit and loss ratio fell to -0.35. The reading marked a 43-month low and indicated broad loss realization across the network.
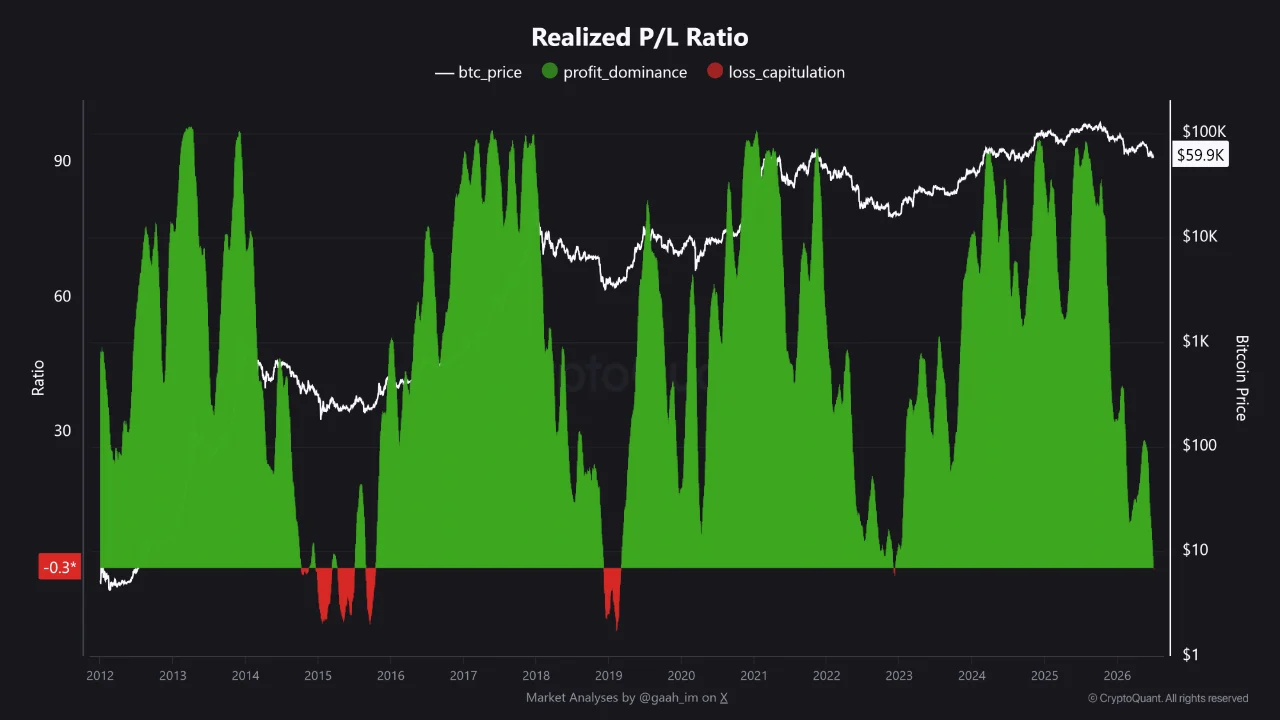 Source: CryptoQuant
The metric measures net realized profitability relative to total Bitcoin supply. Therefore, deeply negative readings show that sellers accepted losses across a large share of transferred coins.
Historical comparisons gave the reading added weight. Similar conditions appeared during 2015 and 2019 before later market recoveries developed.
The last comparable reading occurred in December 2022, shortly after the FTX collapse disrupted crypto markets. Bitcoin then traded below $16,000 as forced selling and counterparty fears spread across the sector.
Still, historical alignment did not confirm an immediate reversal. On-chain indicators can remain depressed while weak demand extends a broader bearish phase.
That distinction mattered because Bitcoin had already suffered a 50% drawdown from its prior peak. Such declines can produce temporary rebounds before sellers fully exhaust remaining supply.
Market sentiment also improved cautiously during the latest recovery attempt. Bitcoin gained more than 7% after reaching a near two-year low on June 25.
The move suggested some buyers accepted exposure during extreme pessimism. However, one rebound offered limited evidence that a durable trend reversal had started.
Bitcoin Price Finds Support as ETF Flows Reverse
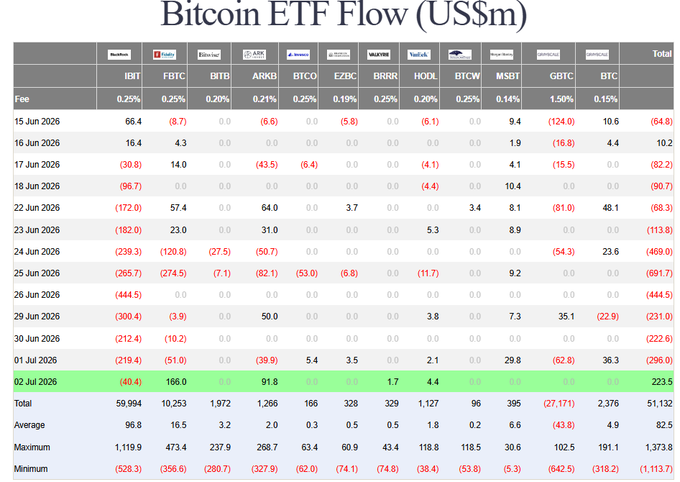
SoSoValue data showed U.S. spot exchange-traded funds attracted $221.7 million during the latest positive session. The reversal ended a 10-day withdrawal streak that had pressured market demand.
Daan Crypto Trades said the flow shift mattered because Bitcoin held its key market region despite persistent redemptions. That resilience suggested sellers met enough underlying demand to limit further downside.
 Source: Daan Crypto/X
June withdrawals had reached roughly $4.5 billion, creating a difficult institutional backdrop. Therefore, the return of positive flows offered an early demand test rather than confirmation of sustained accumulation.
Fidelity’s Wise Origin Bitcoin Fund led the rebound with $166 million of fresh capital. By contrast, BlackRock’s iShares Bitcoin Trust still recorded redemptions, showing demand remained uneven across issuers.
The divergence complicated a simple bullish interpretation. Aggregate flows improved, yet the largest products did not move together during the recovery.
 Source: X
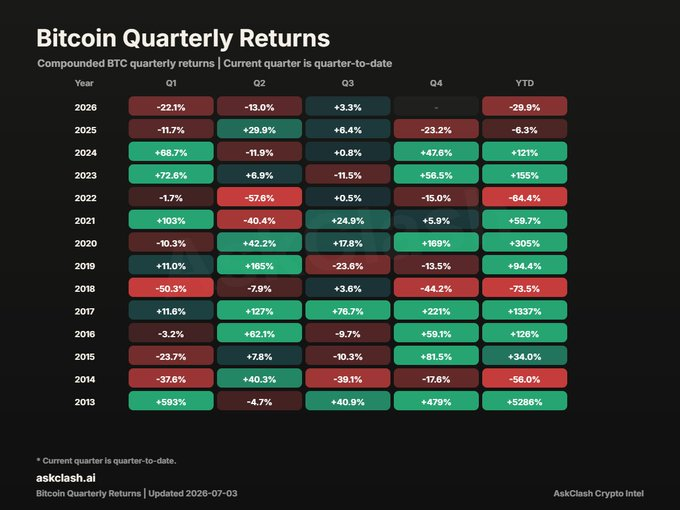
CryptosRus also noted that Bitcoin entered the third quarter in positive territory. That shift followed an almost 30% decline through the first half.
The quarterly setup placed greater weight on follow-through. Without sustained spot demand, an early positive start could fade as traders reduced exposure into resistance.
Bitcoin Price Tracks Strategy Leverage Reset
Bitwise Chief Investment Officer Matt Hougan linked recent market stress to Strategy’s preferred stock structure. He argued that the STRC selloff reflected late-cycle deleveraging rather than a fundamental Bitcoin failure.
STRC had broken below $75 after losing its intended $100 par relationship. The dislocation raised concerns about a financing model tied closely to Strategy’s capital-market access.
Hougan said the episode removed excess leverage from the market. In his view, that process moved Bitcoin closer to a cycle bottom after speculative positioning weakened.
The argument carried broader implications for BTC crypto demand. Strategy had served as a major corporate buyer, making financing stress relevant beyond its own securities.
Yet deleveraging also created a cleaner market structure if forced positions had already exited. That logic supported the bottoming thesis without proving that sellers had finished.
Swan Bitcoin analyst Adam Livingston offered another cost-basis perspective. He said Bitcoin traded only 16% above the network’s realized price.
Livingston linked comparable conditions with historical forward returns of 41% over six months. His dataset also associated those periods with 81% gains across twelve months.
Those figures described prior outcomes rather than guaranteed future performance. Current conditions differed because institutional products, corporate leverage, and macro pressures now shaped liquidity more directly.
The realized price still offered a useful boundary for market stress. Trading near aggregate holder cost basis can expose weak conviction when fresh demand fails to absorb loss-taking.
Bitcoin price now faced an immediate test around the $60,000 region, where recent selling met visible absorption. A sustained hold could support recovery attempts next week, while renewed ETF withdrawals would weaken the bottom thesis.
The post Bitcoin Price Bottom Signal Flashes as 43-Month Metric Hits Low appeared first on The Coin Republic.


추천 콘텐츠

Trump’s Iran Strikes Wipe ₩202 Trillion from Korea

PMI-ACP Exam Preparation: How to Use a Simulator and Practice Questions Effectively

Solana price confirms bearish crossover following Drift exploit, will it crash?


인기 뉴스
더보기
