

XRP (XRP) Price Analysis: Critical Triangle Pattern Reaches Decision Point
Key Takeaways
- XRP currently sits at $1.13, reflecting a 3.21% decline over 24 hours, while daily trading activity fell 43.3% to $1.14 billion.
- Crypto analyst Egrag Crypto observes the Super Guppy technical indicator entering compression mode, indicating weakening price momentum.
- Critical support lies between $0.80 and $1.10; losing this zone could undermine XRP’s long-term technical formation.
- Technical analyst ChartNerd identifies a potential death cross developing between the 20-week EMA and 200-week SMA around $1.20.
- A symmetrical triangle consolidation pattern is reaching its final stage, with bulls eyeing a potential move back toward $2.
As of July 5, 2026, XRP is changing hands at $1.13, marking a 3.21% decline in the last 24-hour period. Market data from CoinMarketCap reveals trading volume has contracted to $1.14 billion, representing a 43.3% decrease. However, the token has managed to post an 8.75% gain across the previous seven days.
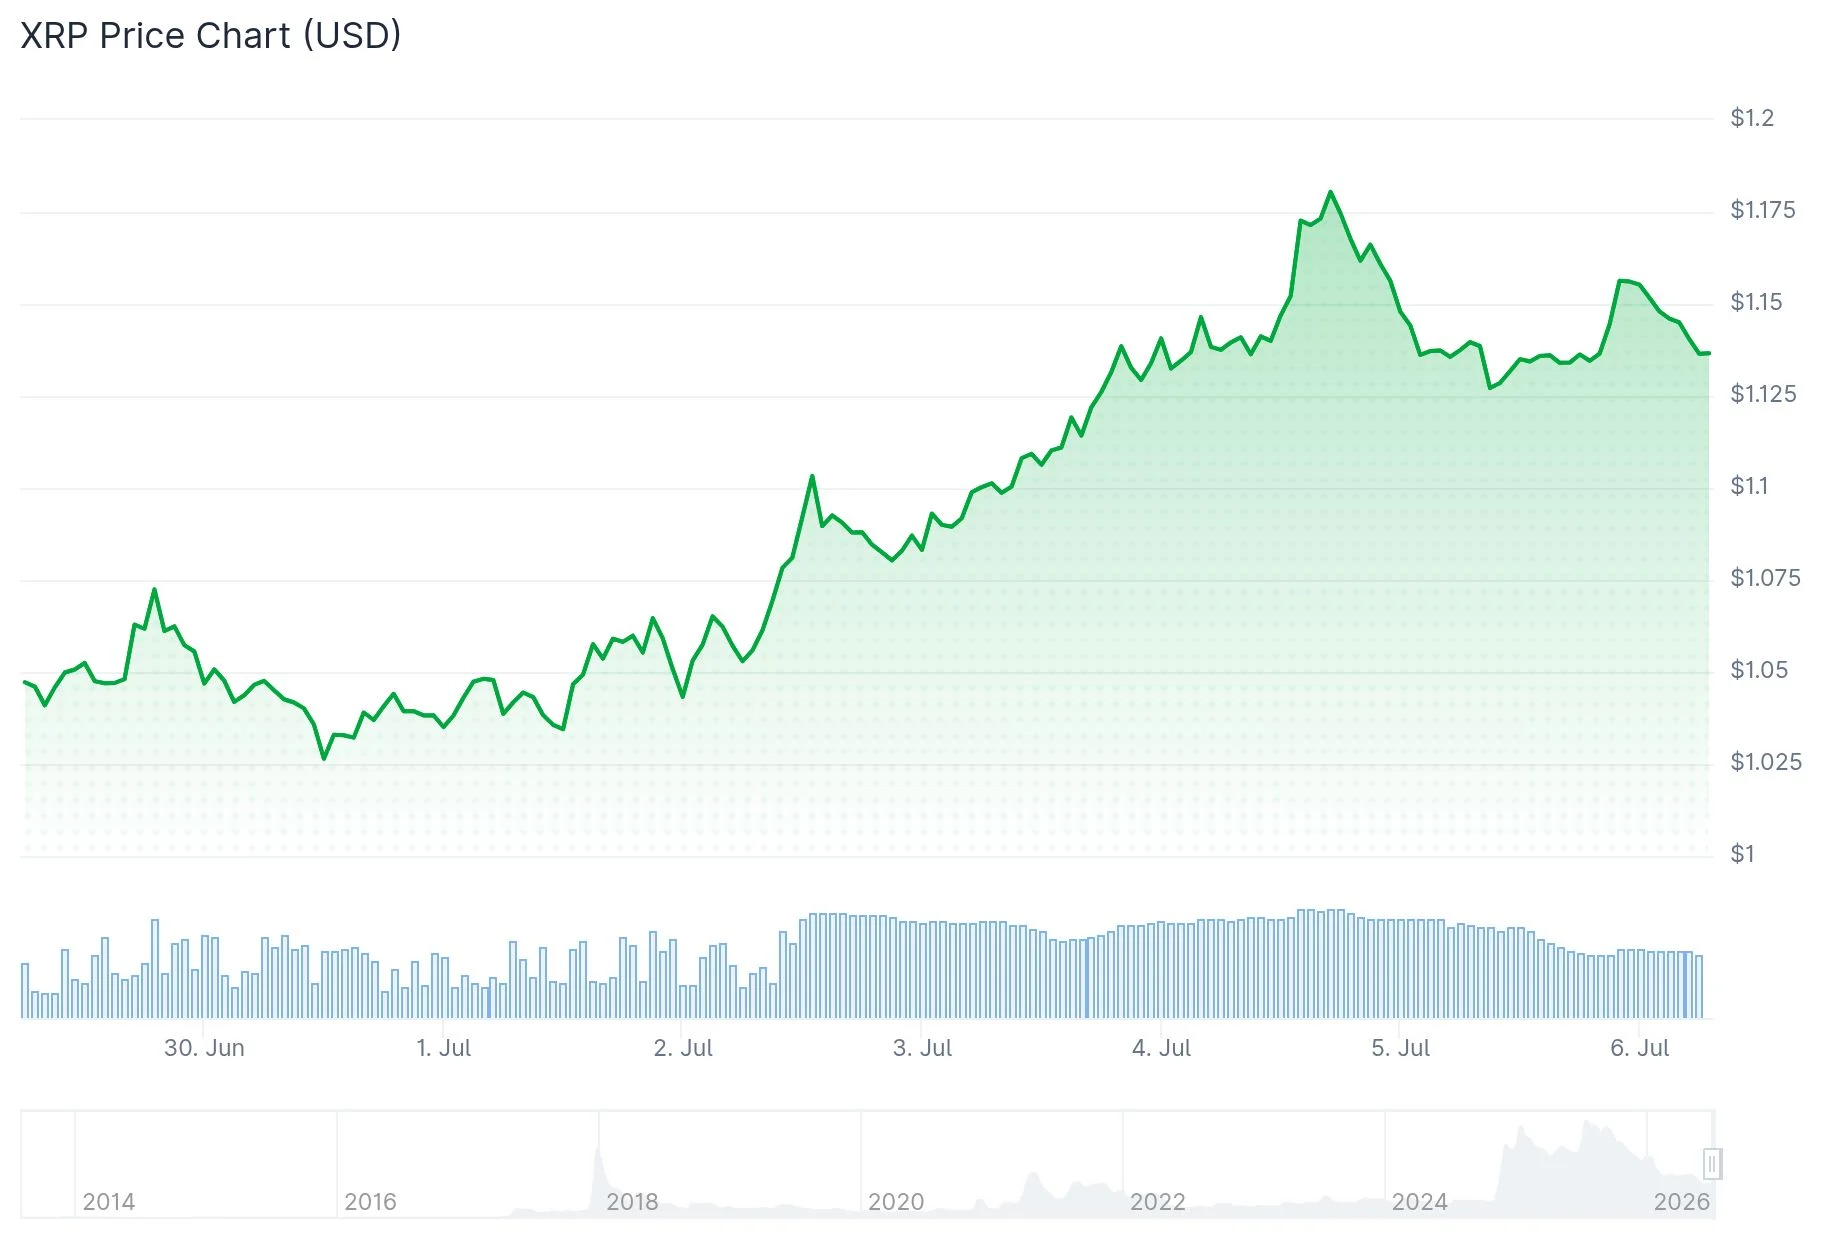 XRP Price
The recent price decline coincides with technical analysts identifying two significant chart patterns. The first suggests declining momentum in the market, while the second raises concerns about a potential bearish indicator appearing on the weekly timeframe.
Market analyst Cryptollica shared insights on X, noting that XRP has reached its most oversold condition in its entire 13-year trading history. Their commentary stated: “This is not where the crowd gets excited. This is where most gives up before the real move begins.” According to Cryptollica, the RSI reading has plunged deeper than during any previous major XRP correction throughout its existence, with price now challenging multi-year structural levels — not following a euphoric rally, but after extended periods of resistance and skepticism.
Well-known crypto analyst Egrag Crypto drew attention to the Super Guppy technical indicator on XRP’s weekly timeframe. His analysis reveals the indicator has transitioned from robust green expansion phase into a mixture of grey and compression coloring. This transformation indicates that upward momentum is beginning to fade.
Egrag characterizes this development as a “macro retest” or “cooldown pattern.” According to his analysis, the $0.80 to $1.10 price corridor represents the critical support area that must hold. Maintaining price action within this band is essential for preserving the larger bullish market structure.
Potential Upside Targets if Super Guppy Turns Green Again
Should XRP successfully defend its support levels, recapture the red moving average zone, and drive the Guppy indicator back into green territory, Egrag has outlined multiple price objectives. These projections include $3.59 as an initial target, followed by a range between $6.73 and $9.17, then $16.36, with an extended cycle target reaching as high as $53.86.
These represent extended timeframe projections. The immediate outlook remains more measured and defensive.
Technical analyst ChartNerd issued a cautionary note that XRP is approaching a death cross formation on its weekly chart. This occurs when the 20-week exponential moving average crosses beneath the 200-week simple moving average. The 200-week SMA currently resides around the $1.20 price level.
ChartNerd highlighted that comparable patterns emerged during previous bear market cycles. During 2022, XRP established a local bottom just one week following the death cross signal. In the more protracted 2018–2020 bear market, the ultimate bottom materialized six months after the crossover.
Drawing from these two historical precedents, ChartNerd projects a possible cycle bottom occurring between June and December 2026, with downside targets of $0.90 or potentially $0.70.
Symmetrical Triangle Pattern Approaches Critical Resolution Point
Independently, blockchain data analytics provider XRP Update has identified a symmetrical triangle consolidation developing on XRP’s price chart. The asset has been trading within converging trendlines — a downward-sloping resistance boundary and an upward-sloping support line — over recent months.
This triangle formation is now reaching its apex point, indicating that the consolidation phase is nearing completion.
A decisive break above the triangle’s upper resistance line, accompanied by substantial volume, would represent the bullish confirmation traders are monitoring.
XRP has simultaneously displayed hidden bullish divergence patterns while RSI readings have formed higher lows. Certain technical analysts interpret this combination as evidence that accumulation is occurring quietly below current price levels.
The RSI divergence combined with the triangle compression pattern collectively suggest a potential advance toward the $2 threshold. Several market observers believe sustained momentum beyond that level could propel prices into the $3 territory.
As of July 5, 2026, XRP continues trading at $1.13, with the $1.20 level — corresponding to the 200-week SMA position — representing the immediate resistance barrier to monitor closely.
The post XRP (XRP) Price Analysis: Critical Triangle Pattern Reaches Decision Point appeared first on Blockonomi.


추천 콘텐츠

Trump tells Netanyahu, ‘You’re f—ing crazy’ and Wall Street sees it as a sign he’s losing patience with the war and wants it done
Biden's Illegal Alien Invasion Sparked 30% Home Price Growth, 20% Rent Growth: Fed Paper

SPARC AI Overwatch Platform Demonstrates Long-Range Maritime Targeting in Major Test


인기 뉴스
더보기
