

XRP Price Flashes Signals We’re Looking For!
XRP price is trading around $1.15 as the crypto market recovery continues into the second week of July. The token has bounced from the recent lows near $1.01 and is now consolidating in the $1.10‑$1.18 range.
Bitcoin reclaimed $63,000. Ethereum pushed above $1,800. Altcoins are showing signs of life. But the recovery is not a straight line.
CasiTrades, one of the best XRP analysts in the community, just posted another price update. If you have been reading our media for some time, you probably know that we like to cover her takes since those are among the best ones – if not the best – in the XRP community.
CasiTrades: Bounces Are Creating the Signals We’re Looking For
CasiTrades posted her latest XRP price analysis on July 6. She acknowledged the momentum that came through in the past week but reminded her followers that upside would be limited until the lower support below $1 is reached.
XRP pushed into $1.18 resistance and was met with a sharp rejection. At the same time, Bitcoin perfectly reached its macro .5 retracement at $64,000 and was rejected as well. The market is sending a pretty clear message.
She expects another pause at $1.09 and $1.00 on the way down to $0.87. The market is overwhelmingly trying to pick up the liquidity it needs before the next major trend begins.
Here is the key part: These bounces are actually healthy. They pull the RSI higher and exhaust selling as price reaches major support. This is exactly the type of behavior you would expect near the end of a correction. It is helping build the signals we are looking for.
XRP Chart Analysis: Resistance Rejection and the Path Lower
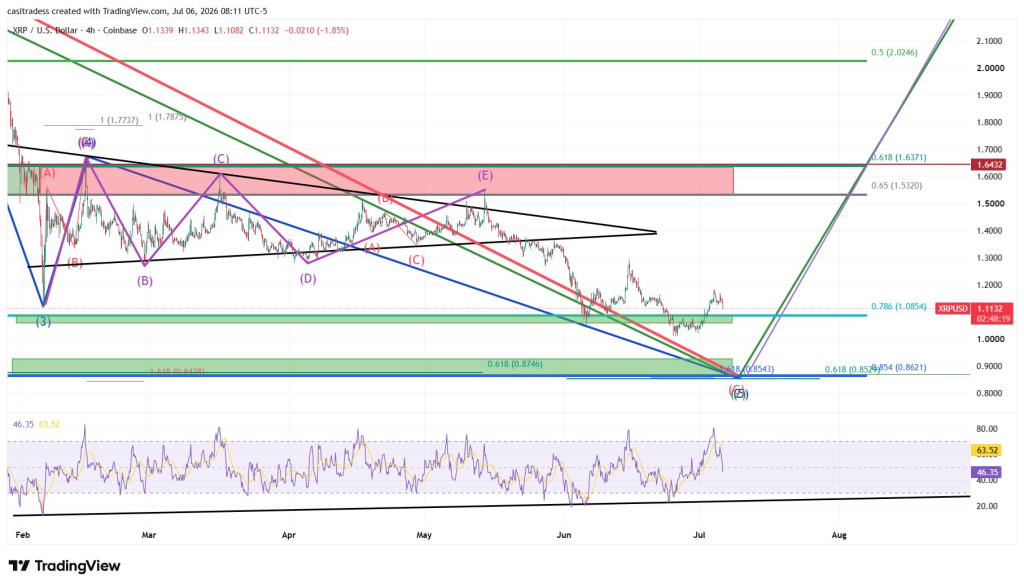
The attached 4‑hour chart from CasiTrades shows XRP/USD on Coinbase.
Price action: XRP is trading at $1.1132 at the time of the chart, down 1.85% in the session. The price pushed to $1.18 and was sharply rejected. That rejection is visible as a long upper wick on the 4‑hour candle.
The resistance zone: The chart shows a descending resistance line that has capped price since the June highs near $1.30. The XRP price attempted to break above $1.18 but failed. That is the same level that acted as support during the downtrend and now flipped to resistance.
The structure: The chart is labeled with Elliott Wave counts. The wave structure suggests XRP is still in a corrective phase. The labels show an (A)-(B)-(C) structure with a (D) wave currently in progress. The lower timeframe structure points to the possibility that price could still be working on the third wave down, as earlier analysis suggested.
The target: The chart shows a 1.618 Fibonacci extension at $0.8746. That is the primary downside target that CasiTrades has been tracking for months. The annotation on the chart shows this clearly.
RSI: The RSI at the bottom of the XRP chart is near 46.35 with a previous reading of 63.52. The RSI has rolled over from overbought territory, confirming that the rejection at $1.18 was real and that momentum is fading.
 Source: X/@CasiTrades
Support zones: The chart shows $1.09 and $1.00 as the next levels on the way down. The $0.87 target remains the ultimate destination before the next major trend begins.
What the chart tells us: XRP is still in a corrective phase. The rejection at $1.18 confirms that sellers are in control. The bounces are healthy because they reset momentum indicators and exhaust selling pressure. The signals are building, but the bottom is not yet confirmed.
XRP Price Prediction – Where Could XRP Go From Here?
The market is sending a clear message. Bitcoin rejected at $64,000. XRP rejected at $1.18. Both assets are showing resistance at key levels.
Short‑term: the XRP price will likely test $1.09 and $1.00 on the way down. These are the liquidity levels that the market is trying to pick up. A pause at each level is possible, but the path of least resistance is lower.
Medium‑term: The $0.87 target remains the primary destination. CasiTrades has been tracking this level for months. The wave structure supports it. The Fibonacci extension confirms it. If XRP reaches $0.87, that could be the final bottom of the correction.
Bullish scenario: If XRP holds above $1.09 and breaks above $1.18 with volume, the bearish thesis would be weakened. A move above $1.30 would invalidate the $0.87 target entirely.
Bearish scenario: XRP continues its downtrend, tests $1.00, and eventually reaches $0.87. That is CasiTrades’ base case.
Subscribe to our YouTube channel for daily crypto updates, market insights, and expert analysis.
The post XRP Price Flashes Signals We’re Looking For! appeared first on CaptainAltcoin.


추천 콘텐츠
JPMorgan sends blunt verdict on oil, economy

Circus Appoints Former Aviation and Automotive Executive as Co-CEO and CFO

Vitalik Buterin Flags Data Exfiltration Risks in OpenClaw


인기 뉴스
더보기
