

MUBARAK Defies the Norm: 116% Volume Surge Sparks a Major Shift on the Charts
- MUBARAK trades at $0.012 following a 6% gain.
- Buyers are stepping in with increasing strength.
Within the fearful market, MUBARAK enters a new month expecting to rebound to recent highs. Currently, the bulls dictate the momentum and are trying to flip the chart green. Notably, the technical structure is positive, with the bullish price alignment confirming that buyers may continue to dominate the broader trend of MUBARAK.
If the buyers gained enough momentum, the asset can easily enter its previous higher zones. At the time of writing, MUBARAK is trading at around the $0.01211 mark with 6.19% surge in value over the last 24 hours. The price is holding above the daily low at $0.01136, and the highest trading level is noted near $0.01212, as reported by the CMC data.
MUBARAK’s Critical Support and Resistance Zones
The ongoing trading pattern of MUBARAK is bullish, and the price might move up to the resistance at around $0.01254. That could be followed by a crucial level above $0.013. A continued upside would trigger the golden cross, sending the price to the crucial areas that determine its stabilisation or more losses.
On the support side, the initial fall of MUBARAK may reach the range of $0.01168. If the price action retraces further as the bears gain traction, it could plunge to $0.010. With the formation of the death cross, the bears can take the asset’s price even lower, to the established support levels.
Technical Structure of MUBARAK
MUBARAK’s four-hour chart shows that the Moving Average Convergence Divergence (MACD) line has crossed above the signal line. It is a short-term bullish signal, suggesting the buying momentum is picking up.
With both lines sitting above the zero line, the broader trend is in positive territory. It’s not a strong breakout signal on its own, but it points to continued upward momentum as long as the lines hold their position.
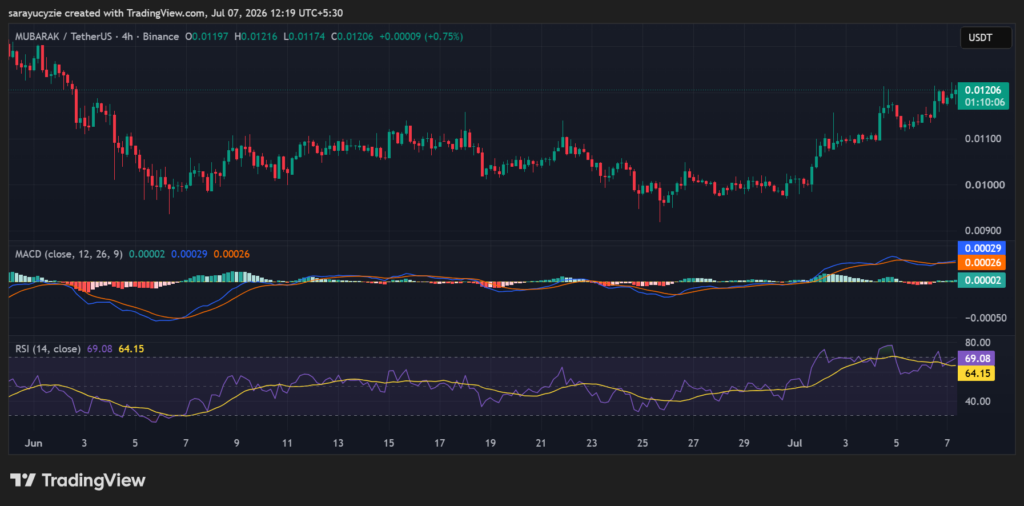 (Source: TradingView)
In addition, the daily Relative Strength Index (RSI) found at 69.08 hints that MUBARAK is approaching overbought territory. That zone usually kicks in at 70, showing the asset is right on the edge, with strong bullish momentum.
It has limited room left before sellers start stepping in. One more push and the asset crosses into overbought, which likely signals a potential pullback or consolidation ahead.
Crypto Market Highlights
Ethereum (ETH) Faces a Crucial Test at $1,750: Can Buyers Sustain the Recovery?


추천 콘텐츠

Franklin Templeton Just Confirmed XRP for Wall Street

Cash Cat Explodes, Then Crashes: What Happened?

PHL signs P124B in Canada energy, critical-mineral investment pledges


인기 뉴스
더보기
