

AAVE Price Prediction: AAVE Holds Key Support as Wallet Activity Hits 5-Year High
Key highlights:
- AAVE is holding key support ahead of the $96.60 and $100 resistance levels
- On-chain activity is gaining momentum, supported by rising wallet activity and record new wallet growth since 2021
- Aave V4, multichain expansion, and bullish sentiment are keeping investors focused on AAVE
Aave is back on the radar. The cryptocurrency has made significant progress after months of tough times, and the AAVE price is currently trading near $92.38. Moreover, the asset is successfully holding above the area of support level which was carefully monitored by traders.
This is not a mere technical breakout for Aave. The protocol has witnessed increased user participation in recent days, and according to Santiment's data cited by CoinDesk and Yahoo Finance, 1,806 new Ethereum addresses were involved in network interactions on June 30 – the highest number in the last seven months.
Coupled with the approaching launch of Aave V4 protocol, further blockchain integration, and increased institutional interest, there are good reasons for the rise of investor interest in the project. But will these events help AAVE to overcome the upcoming levels of resistance?
AAVE has rebounded strongly from its yearly lows
We had a look at the chart shared by analyst Crypto The Boss and the recovery has been hard to miss. The AAVE token was trading around the price mark of $295 in the last half of 2025 but was pulled lower by a selloff trend, resulting in the AAVE token falling to roughly $40.
At present, the AAVE token is trading near $95, marking a significant increase in value compared to the low. The price pattern is positive but faces some resistance areas.
The first resistance area exists around $96.60. In case bulls manage to push prices above the first resistance mark, the next areas are located at $115.70, $152.92, and ultimately $193.76. As for the bearish scenarios, the most notable support area is located between $80-$96.
Aave chart analysis: The charts look more bullish
The technical outlook in the near term is also quite bullish. The daily chart shows that AAVE is trading above its 100-day simple moving average at about $87.42. It represents almost 8% from the current price, and it is a significant positive aspect since AAVE managed to trade above it from late June.
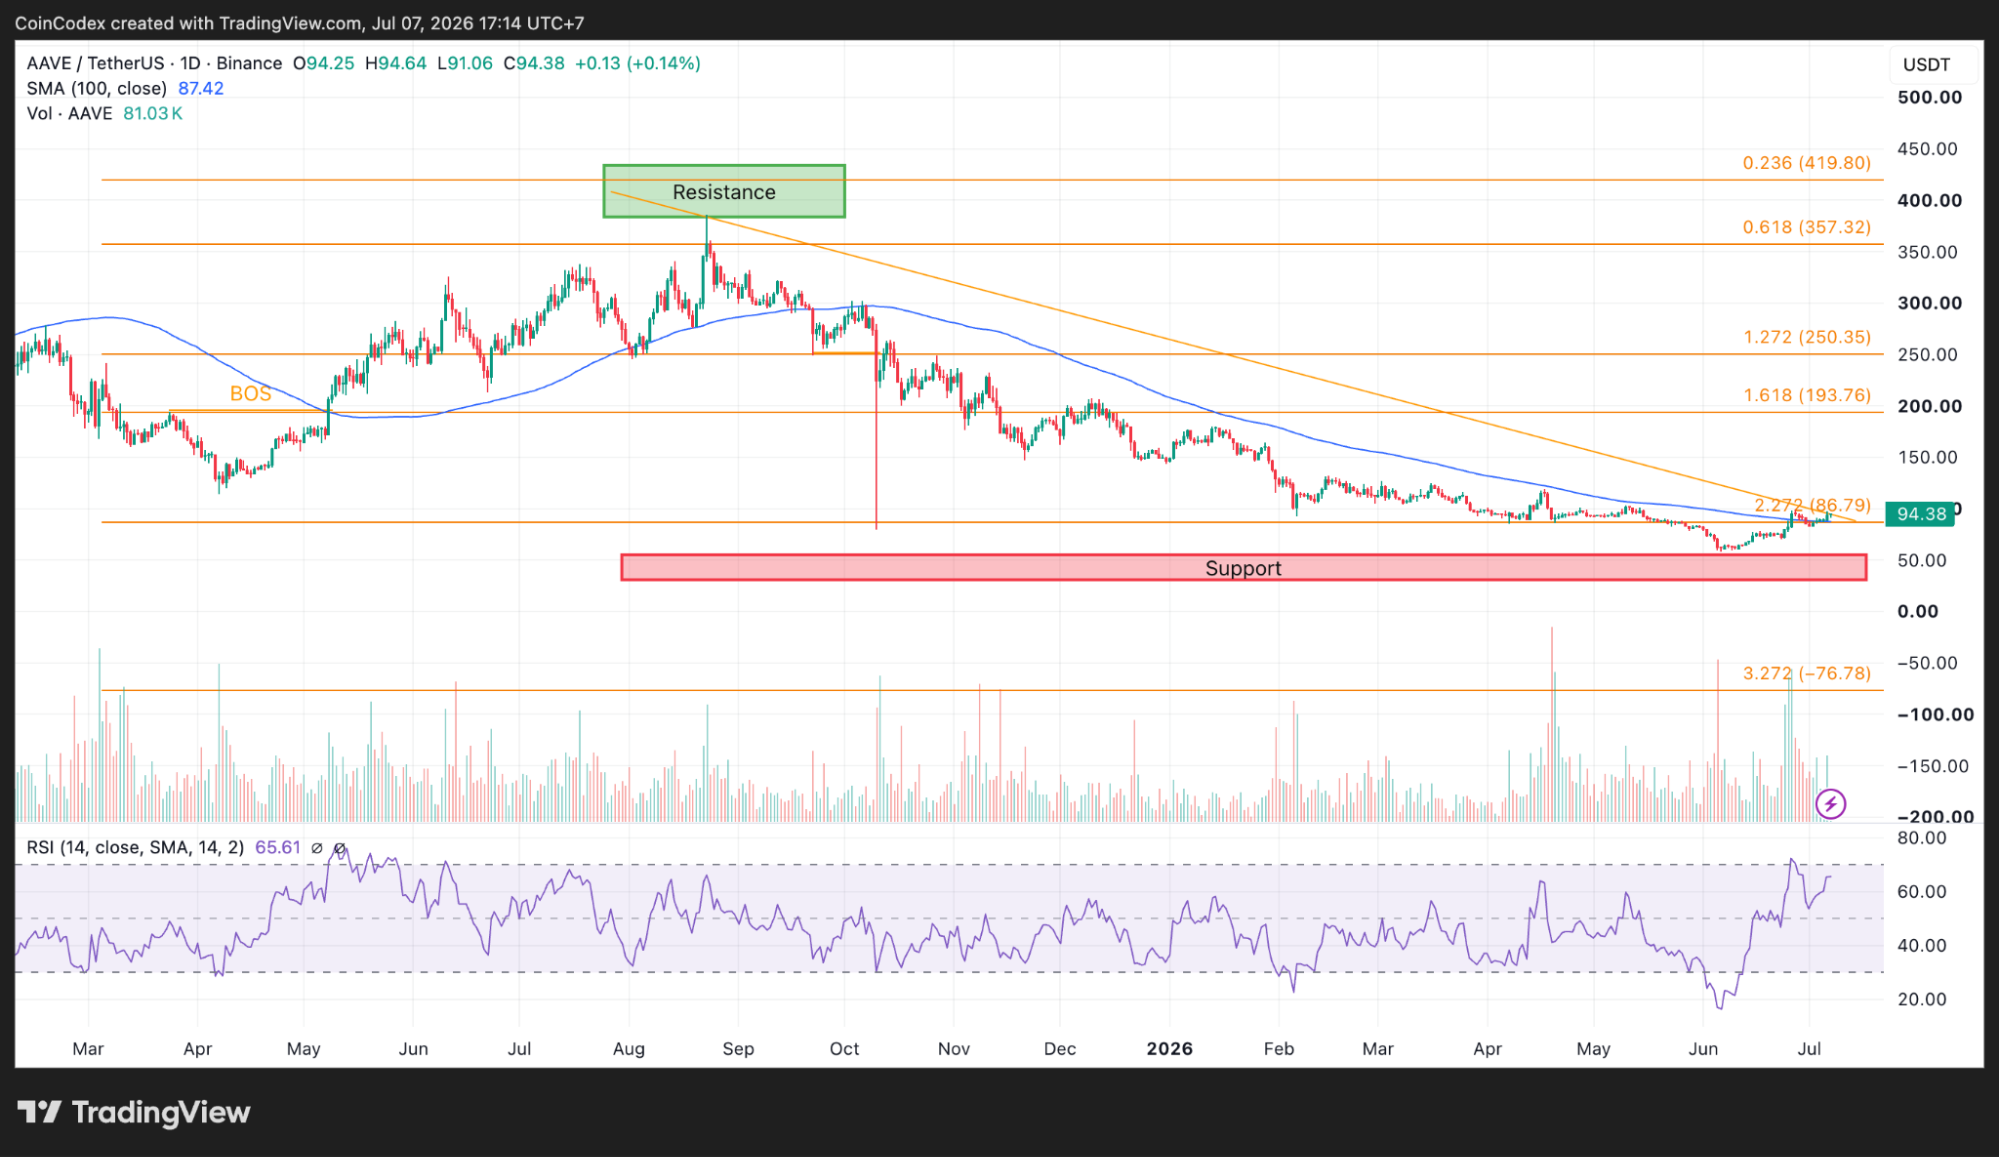
Daily AAVE chart analysis
Moreover, the moving average indicator has started to flatten out after months of showing lower levels, indicating the weakening of the downtrend in the longer-term perspective. Momentum indicators have shown some improvement too. The RSI stands at 65.61 right now. It is lower than the classic overbought level of 70 and significantly higher than the neutral level of 50.
Zooming down to the 4-hour time frame it also reveals a very similar picture. The AAVE price remains above its ascending 100-period moving average, which is currently at $85.49. Meanwhile, the RSI holds at 60.18, indicating that buyers are in control of the trend without making the market look overbought.
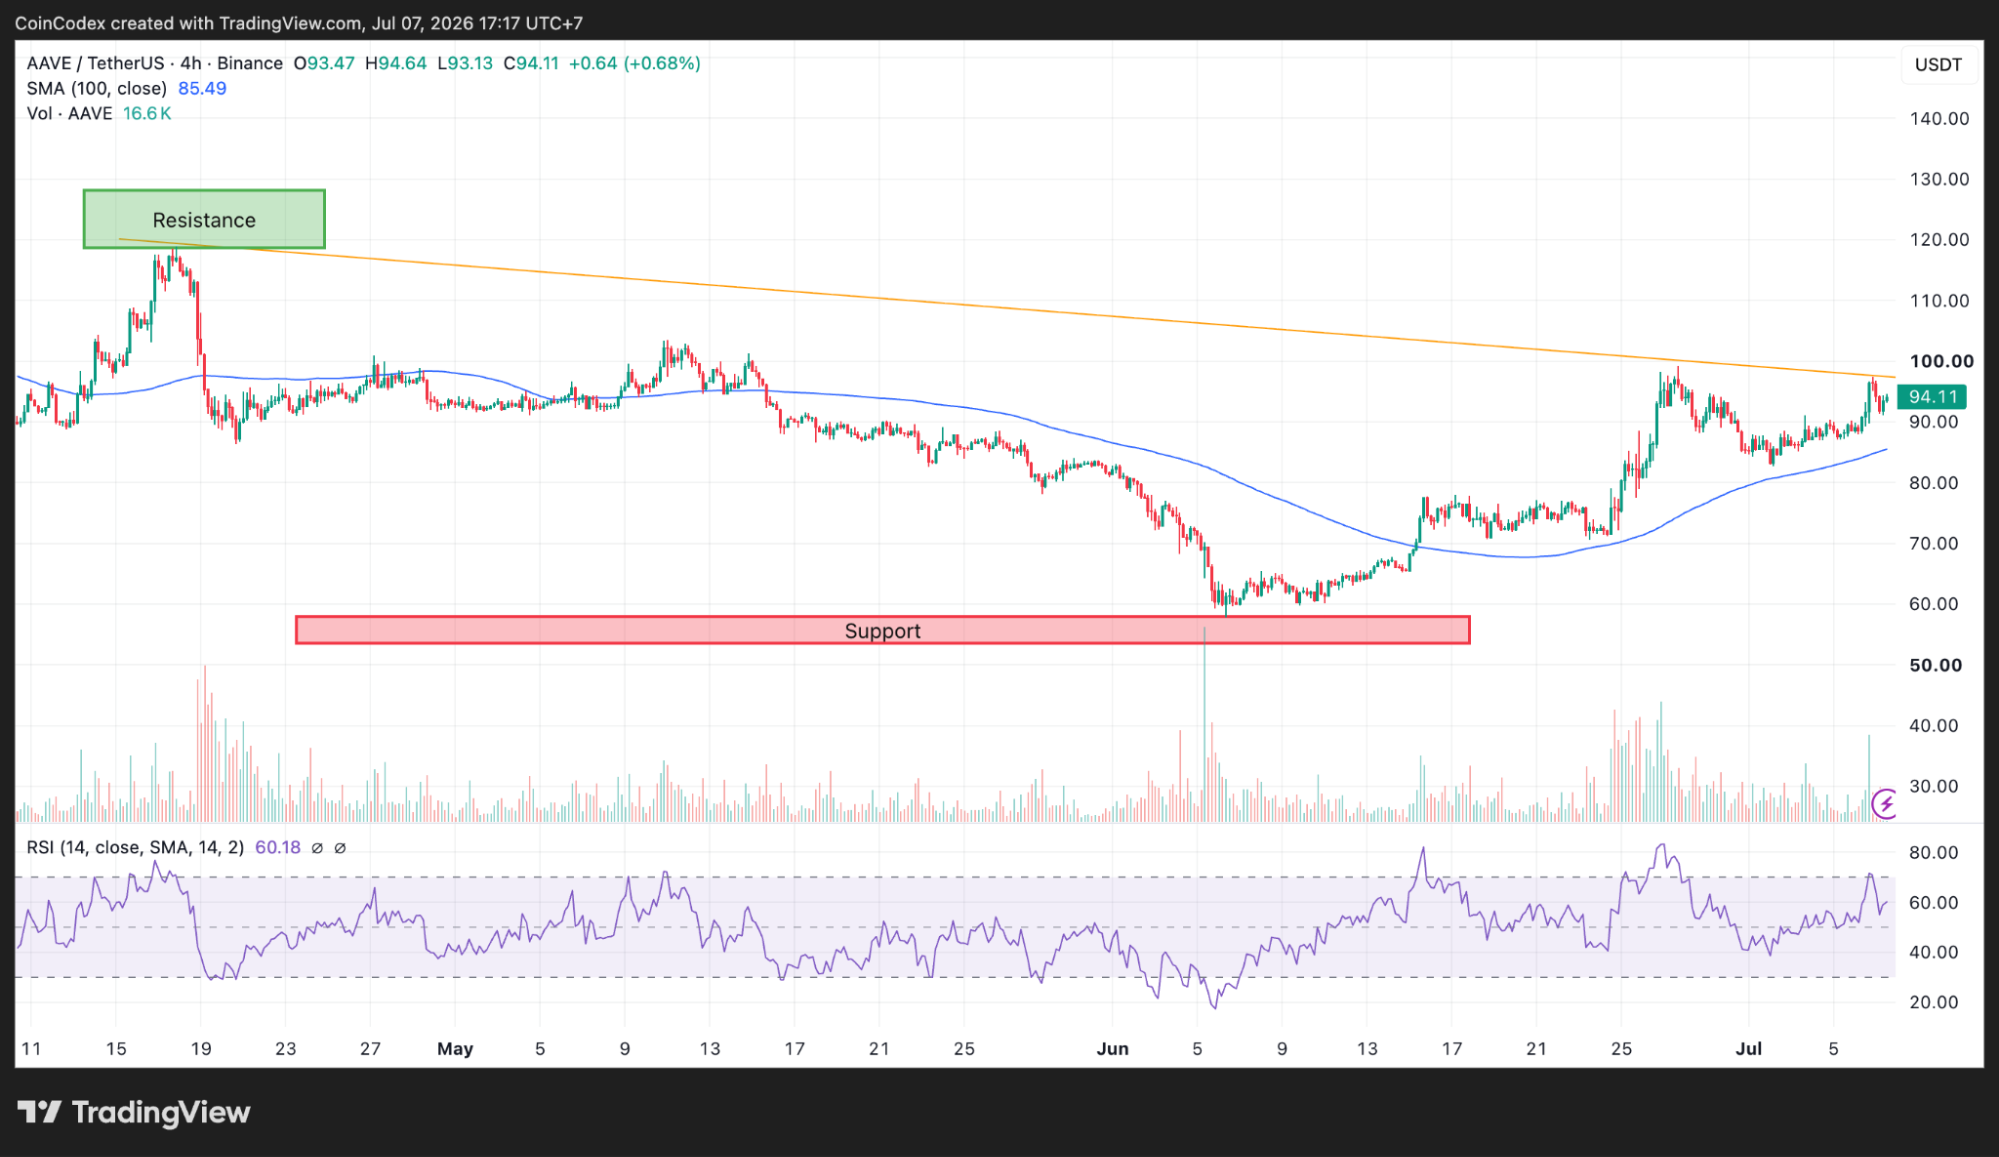
4-hour AAVE chart analysis
There is short-term resistance at $94.64, $96, and then psychologically significant $100 level. An eventual breakout above $100 would quickly shift focus towards the $150 level.
AAVE on-chain activity is picking up
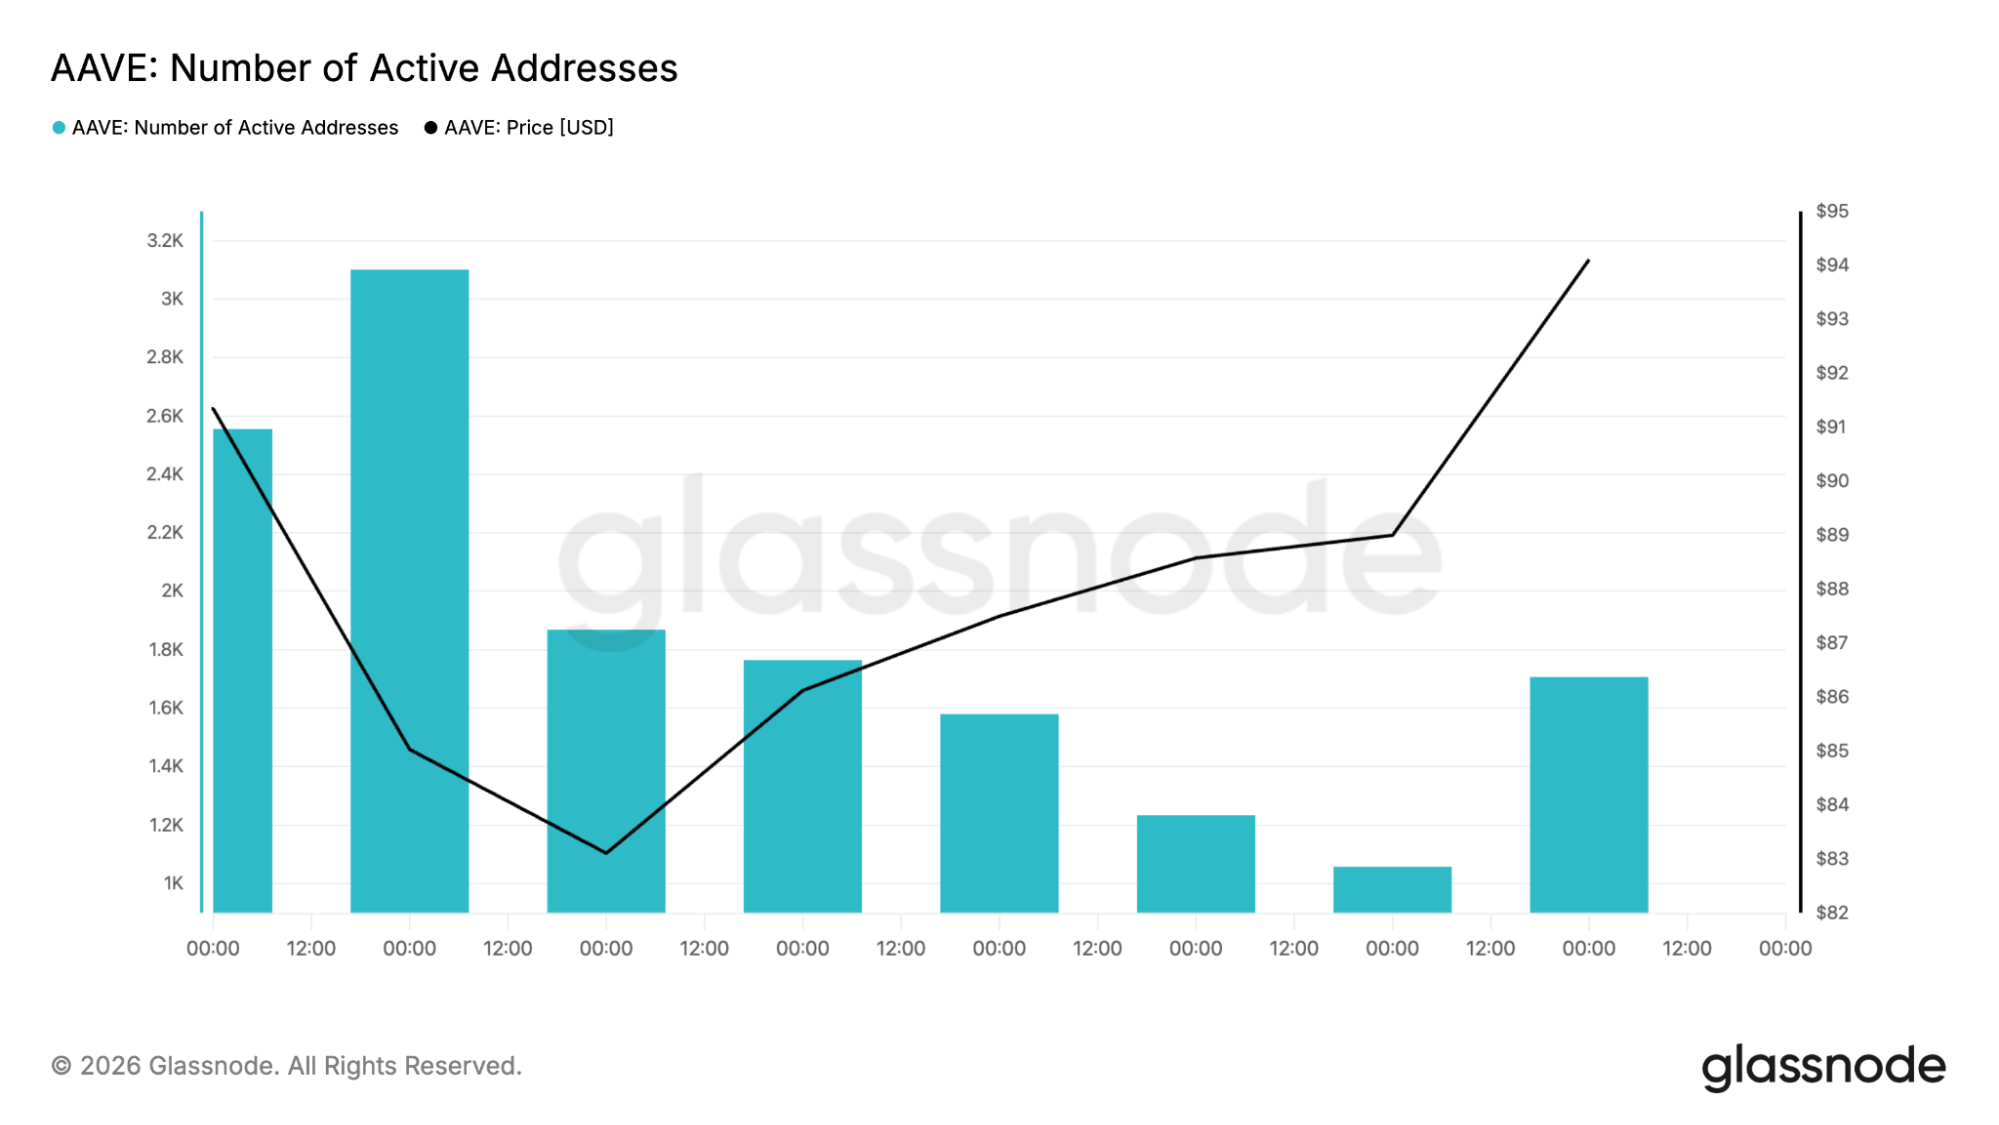
It's not just the price showing signs of strength. However, on-chain data indicates that the activity on Aave has started rising gradually. It can be seen from the rise in active addresses.
Although one graph shows an activity exceeding 220,000 addresses, that particular data does not seem to be correct since the historical data on Aave shows that its usual daily active users range between thousands to ten thousand. Therefore, the rise in activity is more relevant rather than actual figures.
Transaction activity is good too. The network is processing transactions ranging between 10,000 to 10,800 transactions per day, which has slightly increased over time. Consistent transaction activity implies that Aave is being used actively for the provision of various services.
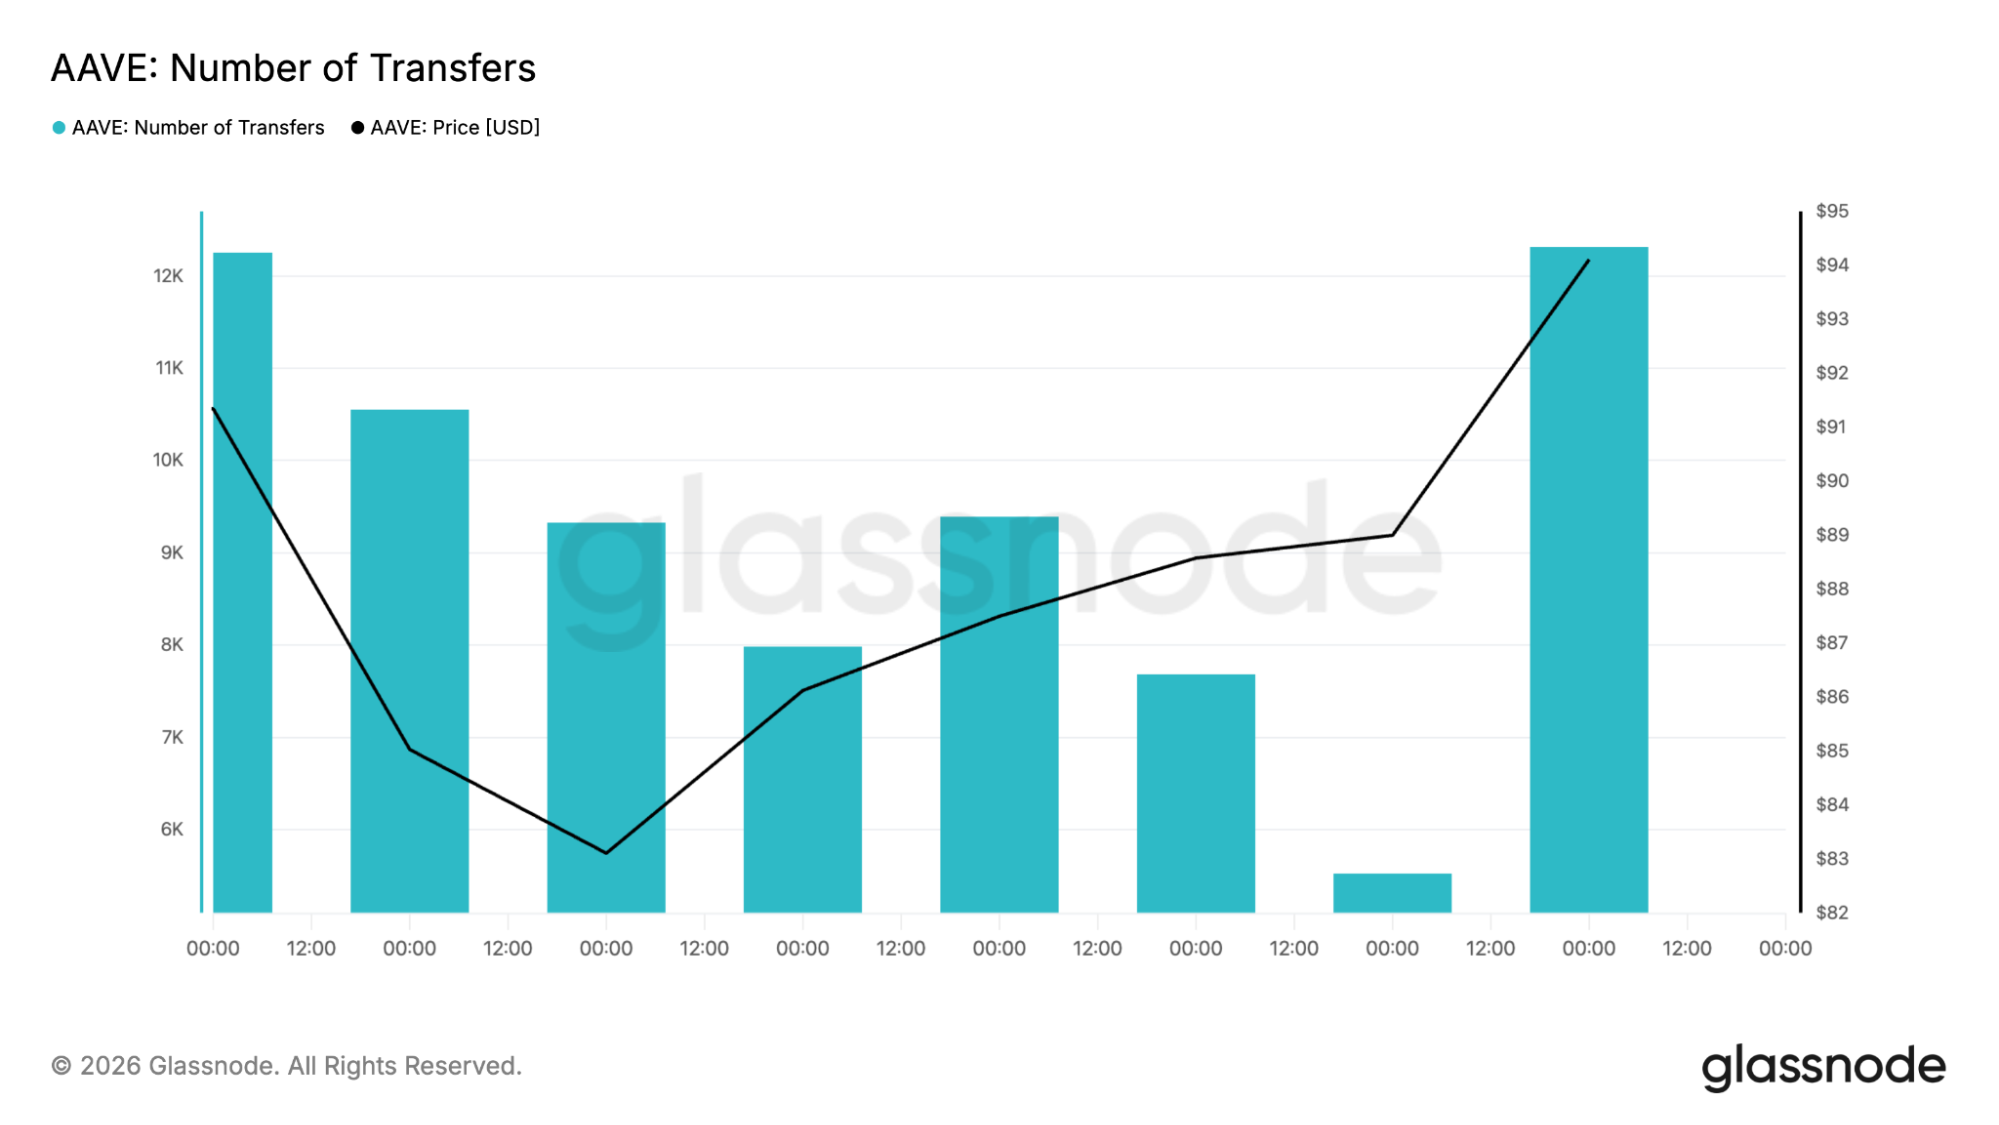
Overall, on-chain data presents an optimistic view. Increasing activity in terms of the number of wallets and transactions means that users' activity continues which provides additional evidence in favor of AAVE's recovery.
Aave saw its biggest wallet growth since 2021
The technical charts aren't the only reason traders are getting excited. On-chain activity has also picked up in a meaningful way. As per Santiment, the number of new Ethereum wallets that connected to Aave was 1,806 on June 30, which is the best day for its network activity since October 2021. These numbers have been featured in both Coindesk and Yahoo Finance as well.
On the other hand, Aave also holds one of the top spots in terms of decentralized borrowing and lending platforms, with $12.2 billion TVL. However, the number of wallets does not necessarily ensure price increase. What they do suggest is that fresh users are entering the ecosystem rather than existing holders simply moving assets between addresses.
The real test comes next. Investors will be watching to see whether these new users begin supplying collateral, borrowing assets, and actively using Aave's lending markets over the coming weeks.
What comes next for AAVE?
This rise is certainly a promising sign, but it would take more than just one day to make sure about a new trend in place. The coming days should tell us whether we can talk about the AAVE’s recovery.
Technically, $96.60 is the important figure to pay attention to here. In case of daily closure above this resistance level, there is an opportunity for $100 and even $115.70. And $150 might turn out to be in reach under bullish pressure.
If AAVE fails to hold the support at the 100-day MA at $87.42, the price may drop down to the $80 levels and below them to former cycle lows.
According to CoinCodex's AAVE price prediction, the price could move to $123.13 over the next month, indicating further upside if buyers can break above the $100 psychological resistance and build enough momentum to target the $115.70 resistance level.


추천 콘텐츠

Pogacar reclaims Tour de France yellow jersey with stage six win

Conservative pundit blasts Mitch McConnell over opaque condition: 'You owe us the truth'

Ollama raises $65M Series B as open-source AI tool hits nearly 9M monthly users


인기 뉴스
더보기
