

Shiba Inu Price Forecast: SHIB demand wanes as holders offload meme tokens
- Shiba Inu price extends its decline on Friday after falling nearly 5% so far this week.
- On-chain data indicate that SHIB holders are offloading meme tokens as geopolitical tensions escalate.
- The technical outlook suggests a further correction as momentum indicators continue to weaken.
Shiba Inu (SHIB) extends its decline at the time of writing on Friday after dropping nearly 5% so far this week. The on-chain data supports a correction ahead, as SHIB holders are unloading tokens amid the escalating Iran-Israel war. The technical outlook indicates a potential price decline as bearish momentum remains dominant.
Shiba Inu investors' confidence fades amid Iran-Israel conflict
The ongoing Iran-Israel war, which has been taking place for more than a week, along with the uncertainty over US President Donald Trump’s tariffs, continues to weigh on risk mood. As the risk-off sentiment hits the crypto market, meme coin cryptos such as Shiba Inu could be hit the hardest due to their highly speculative nature.
Santiment Network Realized Profit/Loss (NPL) metric indicates that SHIB holders are realizing losses, suggesting a decline in investors' confidence, as it shows a massive drop from -346,000 to -211.2 million between Sunday and Monday, the highest drop since March 2024. This negative spike suggests increased selling activity, which would further bring down Shiba Inu prices.
Shiba Inu NPL chart. Source: Santiment
Santiment’s Supply Distribution shows that the number of large-wallet holders is falling. The metric indicates that the whales holding between 100,000 and 1 million (red line) and between 10 million and 100 million (blue line) SHIB tokens have decreased from Wednesday to Friday, further supporting the bearish outlook.
Shiba Inu Supply distribution chart. Source: Santiment
Shiba Inu Price Forecast: Bears in control of the momentum
Shiba Inu's daily chart shows that SHIB faced rejection from the 50-day Exponential Moving Average (EMA), which coincided with a descending trendline (drawn by connecting multiple highs since mid-May), on June 13 and declined nearly 14% until Tuesday. However, on Wednesday, SHIB rebounded slightly after finding support around its daily level at $0.000011. At the time of writing on Friday, it continues to correct, nearly at this daily support.
If SHIB closes below the daily support at $0.000011, it could extend the decline to retest the April 9 low at $0.000010.
The Relative Strength Index (RSI) indicator on the daily chart reads 34, pointing downward toward oversold conditions and indicating strong bearish momentum. The Moving Average Convergence Divergence (MACD) indicator on the daily chart showed a bearish crossover last week. It also shows rising red histogram bars below its neutral level, indicating bearish momentum and giving credence to the downward trend.
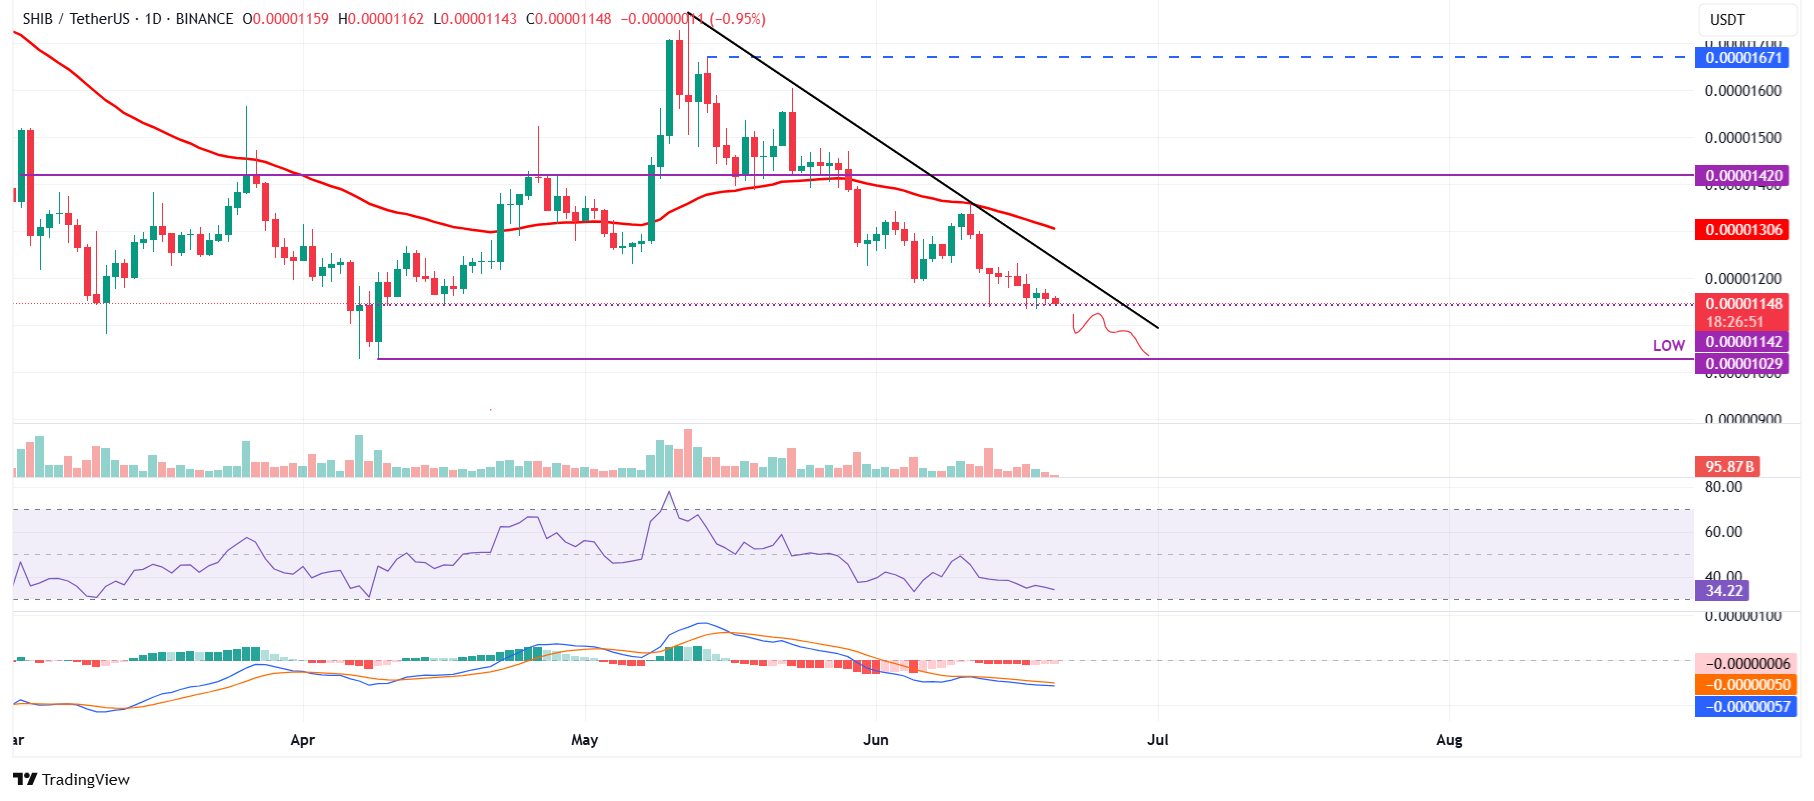
SHIB/USDT daily chart
Looking down at the weekly chart also shows bearish signs. SHIB has continued its six-week streak of red candlesticks since mid-May and has fallen nearly 5% so far this week. The RSI on the weekly chart reads 39, below its neutral level of 50, indicating strong bearish momentum. Moreover, the MACD on the weekly chart is about to flip a bearish crossover, which could further support the downward trend.
If SHIB continues its correction, it could head toward its next weekly support at $0.000011.
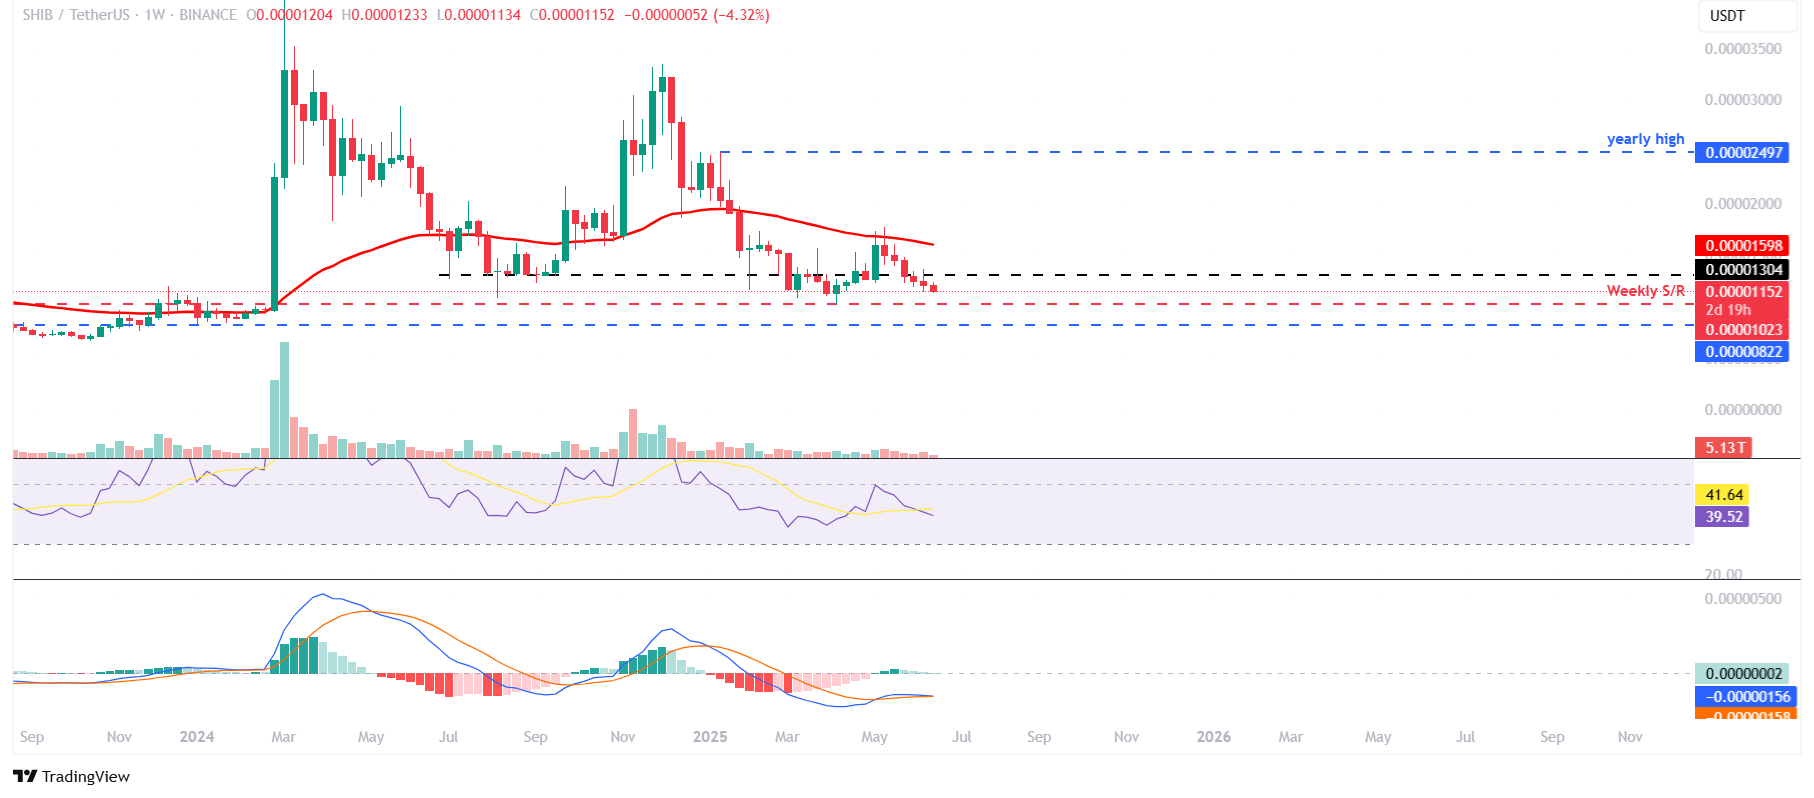
SHIB/USDT weekly chart
On the contrary, if SHIB recovers, it could extend the recovery toward its next weekly resistance at $0.000013.


추천 콘텐츠

New Zealand Dollar Outlook: RBNZ Signals Extended Hiking Cycle, Says TD Securities

From Telegram to Terminal: Banana Gun’s Pro Platform Hits Ethereum as User Base Surpasses One Million

Best Free Social Media Tools for Growth & Engagement in 2026


인기 뉴스
더보기
