

How to Use Drawing Tools (Original K-Line)
Website
App
Popular Articles
View More
The Ethereum Foundation Just Cut Its Budget by 40%: What Does That Mean for ETH's Price? Here's The Ethereum Price Prediction for July 2026
Ethereum opened July 2026 trading near $1,571, a fraction of the roughly $4,950 all-time high it set less than a year earlier. That drop has a lot of people typing the same question into Google in

The US-Iran Peace Deal Just Reset the Ethereum (ETH) Price Prediction, and the Numbers Back It Up
Peace changed the calculus for ETH, and not in the way most investors expected. When the US-Iran ceasefire was confirmed in June 2026, Ethereum did not simply recover alongside the broader market. It

ETH/BTC Ratio: What It Means, How It Moves, and Why It Matters
The ETH/BTC ratio is one of the most closely watched numbers in crypto — and for good reason. It tells you, at a glance, whether Ethereum is gaining ground on Bitcoin or falling behind, without ever

Hot Crypto Updates
View More
ETH Just Crashed Below $1,700 — Is This the Bottom or a Trap?
Overview Ethereum has had a brutal 2026. From a peak near $4,954 in August 2025, ETH tumbled more than 60 percent, briefly touching the $1,600 zone in June after nine consecutive months of selling

Ethlabs Launches Former Ethereum Foundation Researchers Establish New Organization to Drive Institutional Adoption on Ethereum
Ethereum has witnessed the emergence of a new independent research organization called Ethlabs, founded by five former senior researchers from the Ethereum Foundation. Backed by major industry

Market Bleeds, Whales Buy: Inside the $10.7B Ethereum Empire Betting Big on H2 2026
Overview While 338 out of 390 major crypto tokens are in the red, one NYSE-listed company has been quietly building the largest Ethereum treasury in history. Bitmine Immersion Technologies (NYSE:

Ethereum Foundation Hits Reset: Vitalik Reveals Leaner EF, Less ETH Selling, and a CROPS-First Strategy
Vitalik Buterin announces the Ethereum Foundation will "slim down," reduce ETH sales, and refocus exclusively on CROPS — censorship resistance, openness, privacy, and security. Here's what it means
Trending News
View More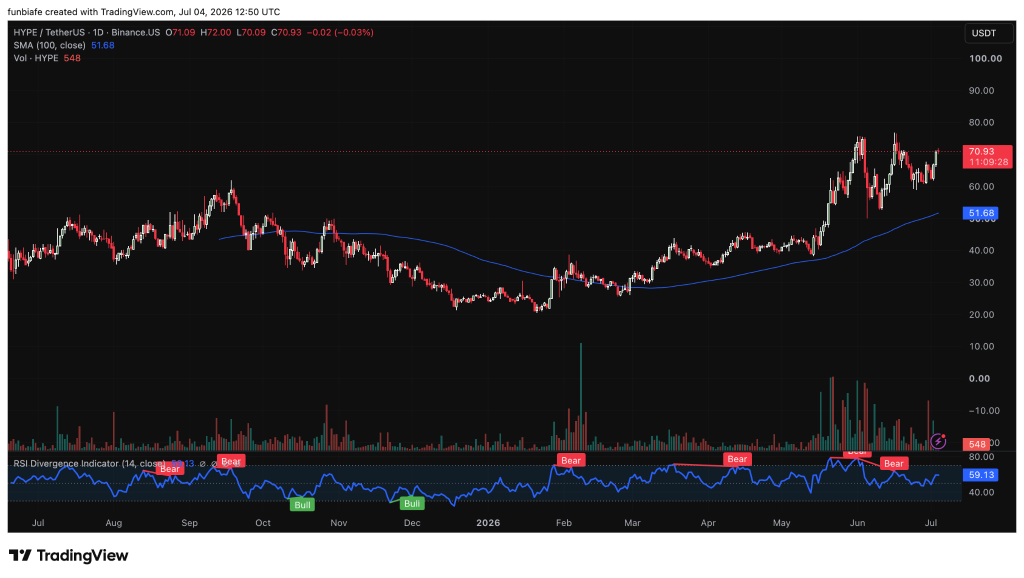
Hyperliquid Price Holds Steady as VALR Integrates HYPE, $89M ETH Short Draws Attention
The HYPE price is holding close to its highs after two major developments put Hyperliquid back on the radar. VALR, Africa’s largest cryptocurrency exchange, has
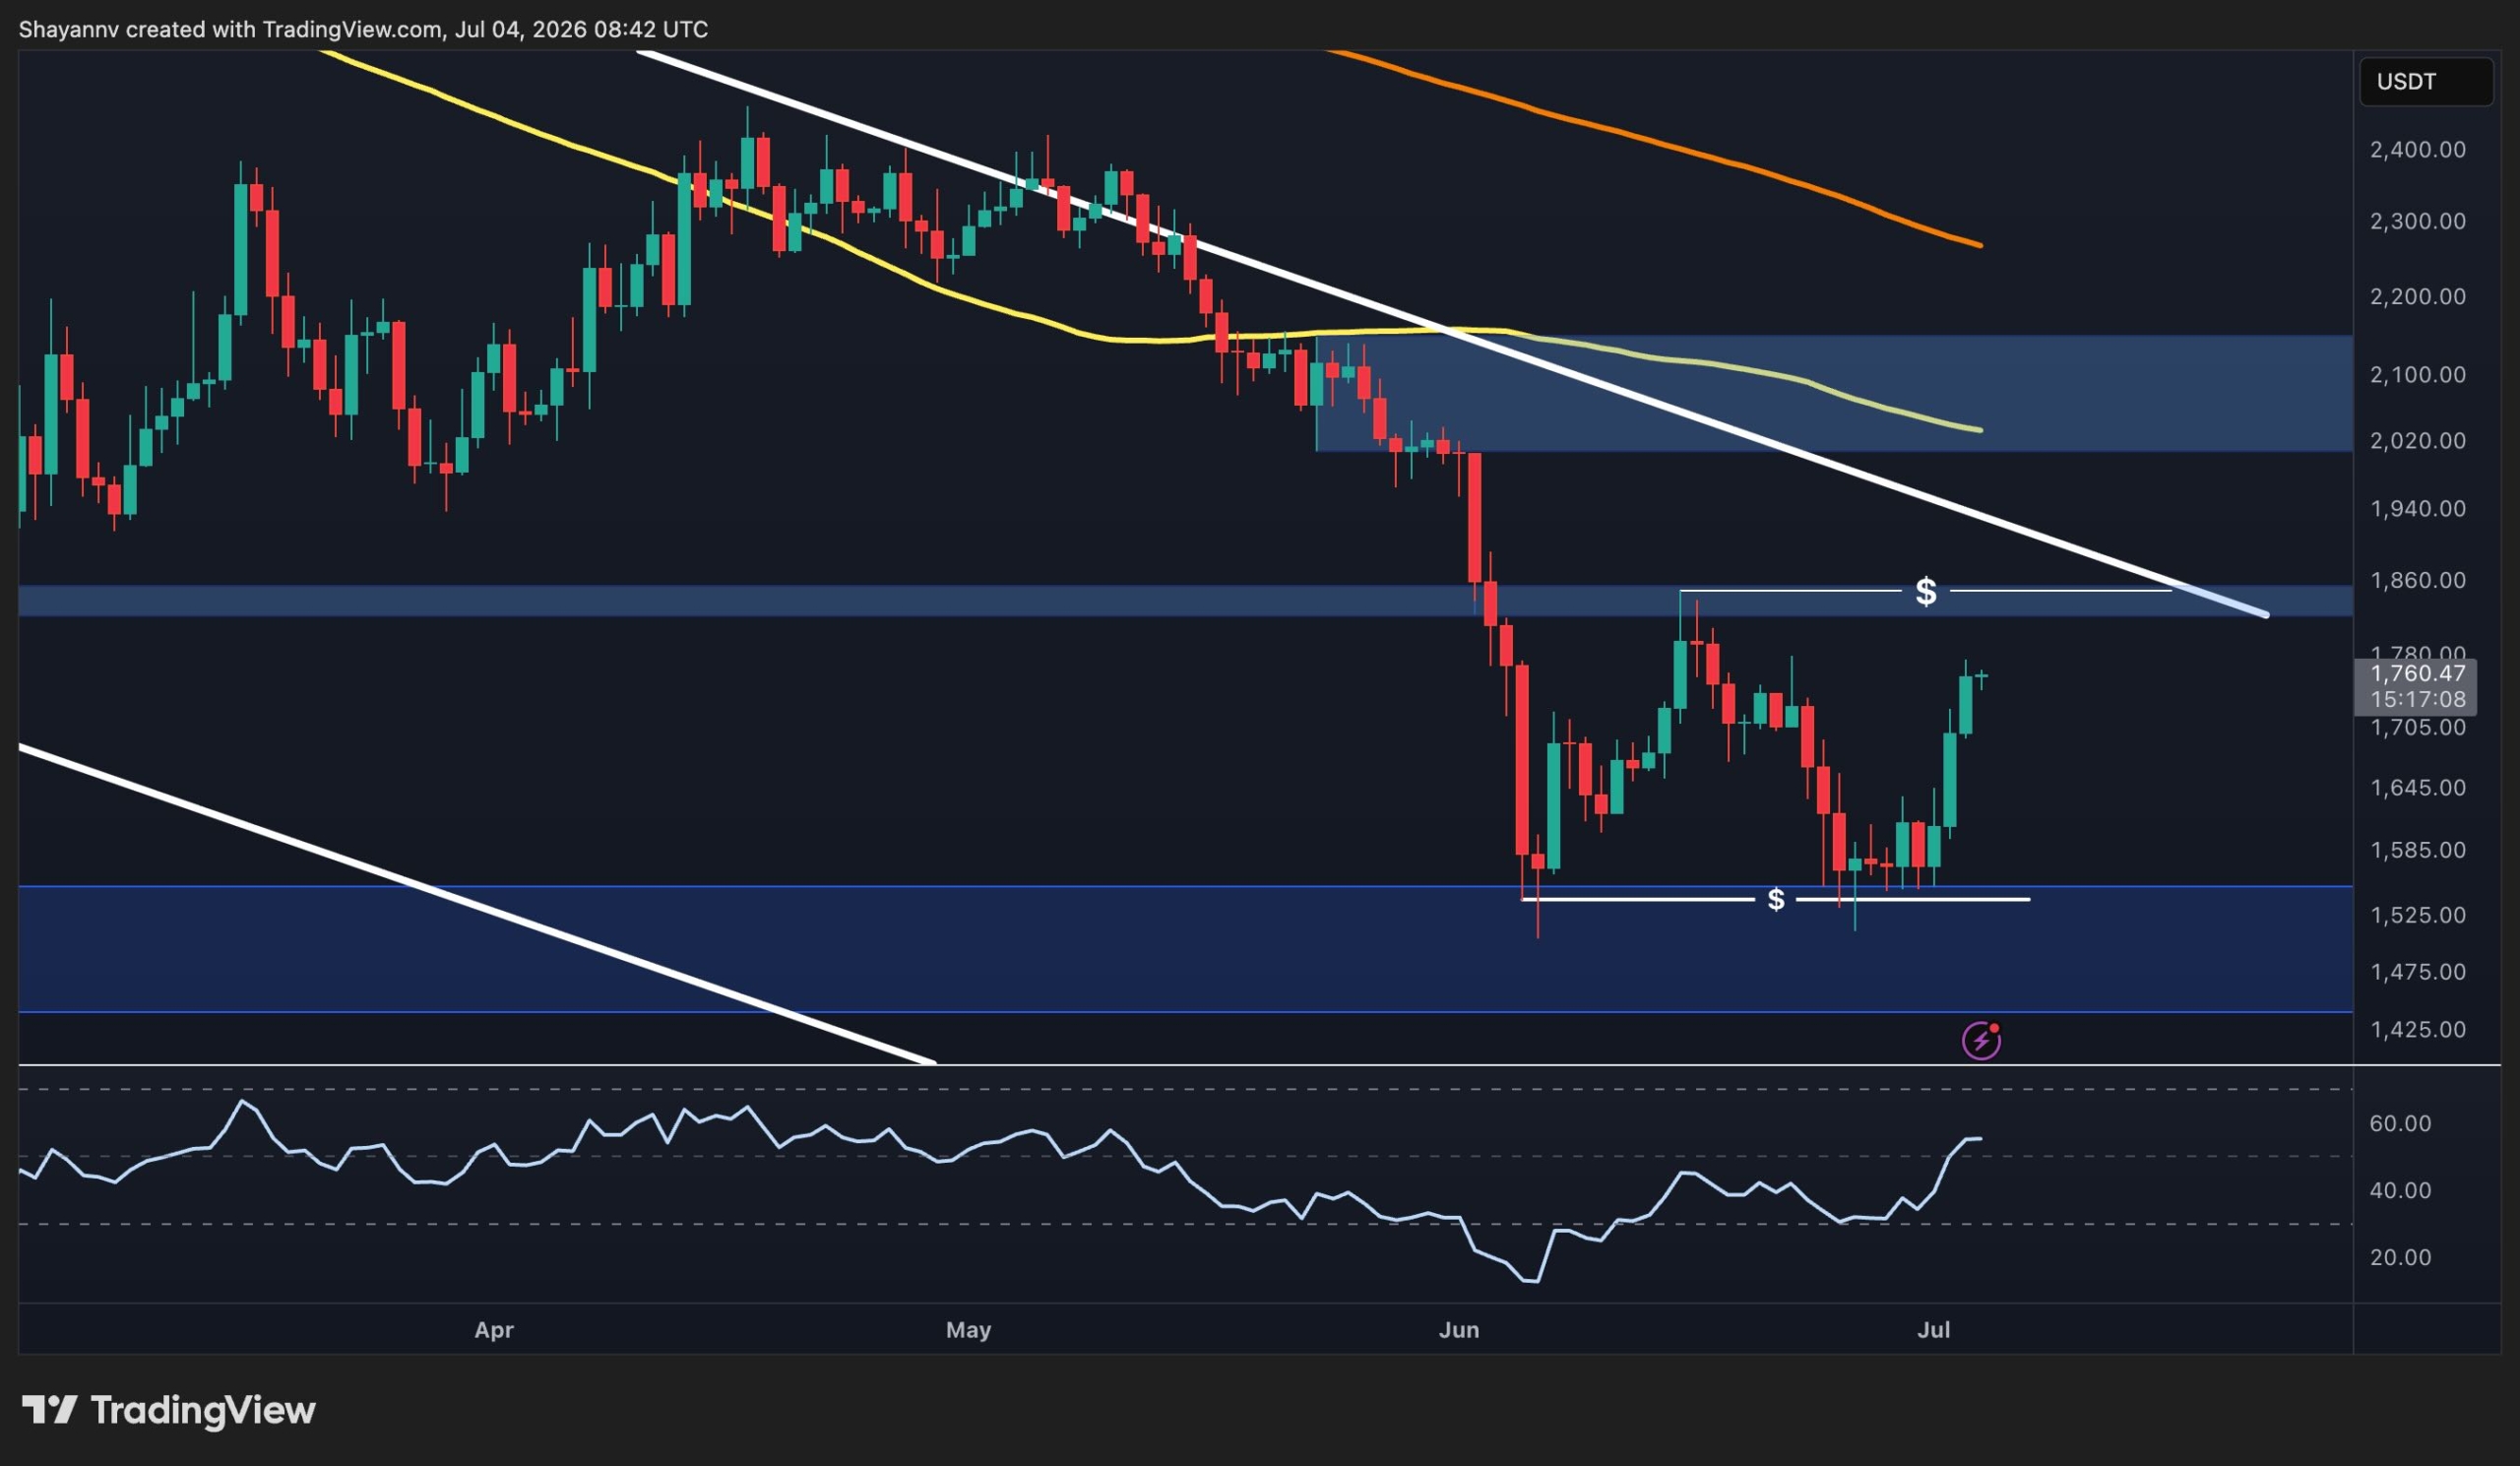
Ethereum Price Prediction Turns Bullish as ETH Clears $1,700
Key Insights: Ethereum traded near $1,758 after rising 1.33% in 24 hours, closely tracking Bitcoin’s 1.27% gain. This Ethereum price prediction now centers on whether

Related Articles
View More
How to Use TradingView on MEXC
TradingView is a powerful trading analysis tool that caters to users of all experience levels. MEXC has integrated TradingView's charting tools, allowing you to use them directly on the MEXC platform.

Analysis of Common Technical Indicators in the Cryptocurrency Market
In crypto trading, technical indicator analysis refers to a quantitative method that uses mathematical and statistical formulas to assess market trends. By processing price and volume data through spe

What Is the Stochastic Indicator (KDJ)?
The Stochastic Indicator (KDJ) is a technical analysis tool that analyzes price trends to assess market strength and identify overbought and oversold conditions, helping traders make buy and sell deci


