What is a Heatmap? MEXC Heat Map User Guide
1. What is a Heatmap? A Visual Tool for Tracking Market Sentiment
2. Key Features and Advantages of the Futures Heat Map
2.1 Quickly Identify Market Hotspots
2.2 Accurately Filter Trading Opportunities
2.3 Visual and Interactive Experience
3. How to Read the Futures Heat Map
Case 1: High Trading Volume and Strong Price Drop
Case 2: High Trading Volume and Sharp Price Increase
Case 3: Low Trading Volume but High Price Volatility
4. Futures Heat Map User Guide: Web and App Instructions
4.1 Web Version
4.2 App Version
5. Conclusion
- What Is the Stochastic Indicator (KDJ)?: A beginner-friendly guide to understanding K-line movements and mastering entry and exit timing.
- What is Parabolic SAR?: Helps traders hold positions during trends and signals exits during price reversals.
- How to Use TradingView on MEXC: A complete introduction to TradingView on MEXC, ideal for all futures traders looking to enhance their market insight and trading precision.
Popular Articles
View More
XAU (Gold) Technical Analysis: Actionable Charting for Tokenized Gold Traders
When looking at the global XAU/USD charts, analyzing trendlines and moving averages is only half the battle. For modern traders, the ultimate goal isn't just to map the trajectory of physical gold,

How to Read a BTC Liquidation Map and Trade Smarter?
Trading Bitcoin with leverage can be profitable, but it comes with serious risks. One wrong move and your position gets liquidated, wiping out your investment in seconds. A BTC liquidation map shows

The Ethereum Foundation Just Cut Its Budget by 40%: What Does That Mean for ETH's Price? Here's The Ethereum Price Prediction for July 2026
Ethereum opened July 2026 trading near $1,571, a fraction of the roughly $4,950 all-time high it set less than a year earlier. That drop has a lot of people typing the same question into Google in
U.S. Stock Weekly Report | June 22–26: Three Rate Hikes Test Market Resilience as AI Hardware Supercycle Comes Into Question
This week, U.S. equities experienced a textbook case of a "rate shock + sector rotation" market structure. A rate hike projection report from Bank of America (BofA) triggered a sharp sell-off in
Hot Crypto Updates
View More
Glamsterdam Enters Final Phase as the quest to Push Ethereum L1 Toward 10000 TPS Draws Closer
Overview Glamsterdam is Ethereum's most substantial hard fork since the Merge, currently running its full EIP slate across multi-client developer networks ahead of a mainnet activation targeted for

BEEG Blue Whale Liquidity Map Decoded: Where Are the Real Support Levels Hiding in 2026?
Where are the key support levels in BEEG Blue Whale's liquidity map? This in-depth 2026 analysis decodes BEEG's order book microstructure, critical support zones, on-chain signals — and why MEXC is

Is ANSEM Legit? What Traders Need to Know
Overview ANSEM, also known as The Black Bull, has become one of the most discussed Solana meme coins in recent days. Its momentum has been driven by crypto influencer Ansem, community speculation,

Trump Made Over $1 Billion From Crypto While the Industry Slumped: What It Reveals About Crypto’s New Profit Model
While much of the cryptocurrency market spent the past year grappling with declining prices and weaker investor sentiment, one of the industry’s most surprising success stories came from an unlikely
Trending News
View More
AI tourism conference: Ethiopia’s digital pivot
AI tourism conference momentum puts Ethiopia on the map as AI reshapes African hospitality and investment. The post AI tourism conference: Ethiopia’s digital pivot
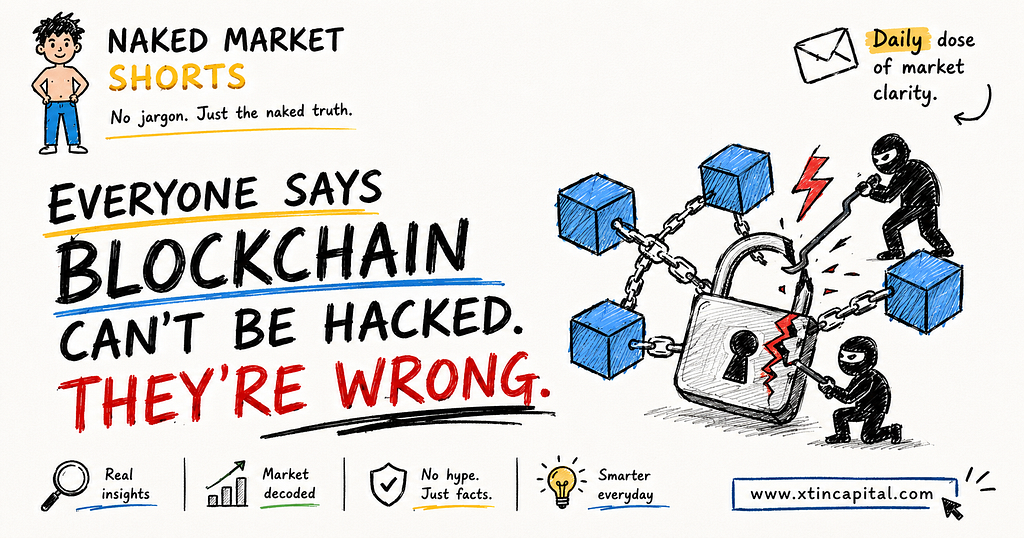
Everyone Says Blockchain Can’t Be Hacked. They’re Wrong.
Crypto lost $3.4 billion last year, and almost none of it was the chain breaking. A map of the four floors where money actually gets stolen and the one floor no
Related Articles
View More
The Complete Guide to Coin-M Perpetual Futures on MEXC
In cryptocurrency derivatives, Futures trading enables investors to apply leverage to increase potential returns and to take positions in both rising and falling markets. MEXC offers two primary types
What is MEXC Futures Earn?
1. What is MEXC Futures Earn?Futures Earn is a financial product offered by MEXC for Futures users. Once activated, eligible funds in your Futures account will automatically enroll in this exclusive E

MEXC AI Strategy for Beginners: How AI Quant Trading Works
Key Takeaways:MEXC AI Strategy is officially live, allowing users to generate futures trading strategies using natural language, making it easy for beginners to get started. It integrates social media