ETH Price Forecast: Weekly Technical Analysis and Market Trends
Ethereum (ETH) enters the new trading week at a critical crossroads, balancing improving short-term momentum against a broader bearish structure. Recent institutional flows, technical signals, and macro sentiment are creating a mixed outlook that traders cannot ignore.
Below is a deep weekly breakdown of ETH’s technical setup, key reasons behind price action, and the latest market news shaping sentiment.
Current ETH Market Snapshot
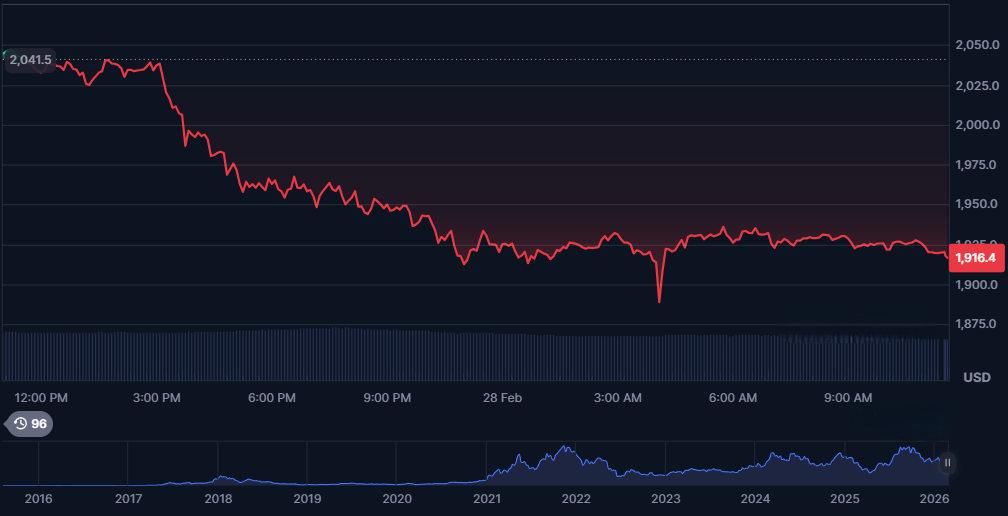
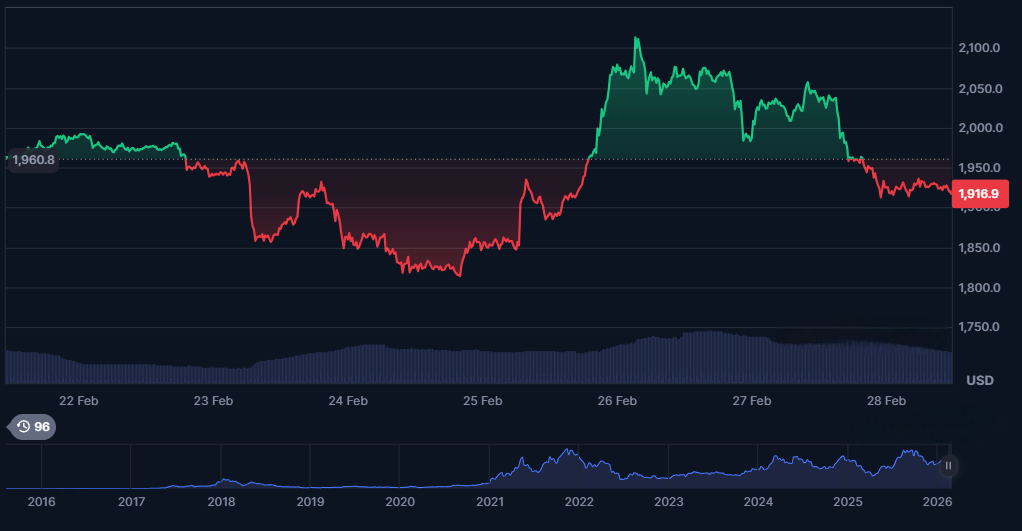
Ethereum has been trading in a volatile range near the psychological $2,000 level, with repeated attempts to reclaim higher resistance zones. The asset briefly pushed above $2,100 but struggled to maintain upside momentum.
This consolidation phase reflects uncertainty rather than outright weakness. While buyers are slowly returning, the broader trend still shows caution among large market participants.
Key Levels to Watch
- Immediate resistance: $2,080–$2,150
- Major resistance: $2,200
- Key support: $2,000
- Breakdown risk zone: $1,900–$1,775
Weekly Technical Structure
From a technical perspective, Ethereum remains in a larger downtrend despite signs of short-term recovery. The market has printed lower highs and lower lows since losing the $3,000 region earlier in the cycle.
Recent data shows ETH trading near $2,026 after bouncing from session lows around $1,981, indicating buyers are defending the $2,000 zone. However, analysts note that the asset still faces heavy overhead resistance near the 20-day EMA and the $2,100 region.
Technical Signals
- RSI around 38 suggests lingering bearish pressure but not oversold conditions.
- MACD shows early bullish momentum building.
- Price remains below major EMAs, confirming the broader downtrend.
Interpretation: Short-term relief rallies are possible, but the macro trend has not yet flipped bullish.
Reasons Behind Recent ETH Volatility
Multiple fundamental and structural factors are driving Ethereum’s uneven price behavior this week.
1. Institutional Flows Are Turning Mixed
One of the biggest catalysts has been shifting institutional participation. Ethereum spot ETFs recently recorded about $9.23 million in net inflows after weeks of outflows, helping spark a brief rally above $2,000.
At the same time, derivatives positioning remains cautious. Futures sell pressure previously pushed the Binance buy/sell ratio below equilibrium, contributing to the recent decline.
Bottom line: Smart money is returning—but not aggressively enough yet to confirm a trend reversal.
2. Options Expiry Risk Is Increasing Volatility
A major near-term risk comes from the large options expiry cluster. Roughly $893 million in ETH options are set to expire near the $2,200 max-pain level, which can amplify price swings.
This creates a classic “magnet effect,” where price may gravitate toward key strike levels before expiry. Traders should expect choppy price action throughout the week.
3. Network Fundamentals Remain Strong
Despite price weakness, Ethereum’s underlying fundamentals continue to improve. Developers are advancing the roadmap, including the planned Glamsterdam upgrade aimed at cutting gas fees by nearly 79% and improving MEV decentralization.
Long-term projections remain constructive. Some analysts believe ETH could end 2026 modestly higher, supported by DeFi growth and ETF inflows.
Key takeaway: Fundamentals are bullish long term, but price is lagging.
Weekly Forecast Scenarios
Bullish Case
If ETH holds above $2,000 and breaks $2,200:
- Momentum could accelerate toward $2,400
- Short liquidations may fuel a squeeze
- Institutional inflows could expand
Probability: Moderate but requires confirmation.
Bearish Case
If ETH loses $1,900 support:
- Next downside target: $1,775
- Broader downtrend likely continues
- Fear sentiment may intensify
Probability: Still significant given current structure.
Neutral/Base Case (Most Likely)
Ethereum may continue ranging between $1,900 and $2,200 while the market waits for a decisive catalyst such as ETF momentum, macro easing, or major network upgrades.
Final Outlook
Ethereum’s weekly outlook is cautiously neutral with a slight bearish bias in the short term. Technical structure has not fully flipped bullish, but improving institutional flows and strong network development provide a supportive floor.
For traders, the $2,000 level remains the battlefield. A clean breakout above $2,200 could shift momentum quickly, while a breakdown below $1,900 would confirm continued weakness.
The next few weeks will likely determine whether ETH is forming a long-term base—or preparing for another leg down.


You May Also Like

Tech layoffs in Q1 2026: A roundup of major job cuts amid AI-driven restructuring

Q2 Market Insights: Bitcoin regains dominance in risk-averse environment, ETFs remain critical to market structure