TVL is just a vanity metric. What really matters is who controls the flow of liquidity, not who owns the protocol or even who hands out the most rewards.TVL is just a vanity metric. What really matters is who controls the flow of liquidity, not who owns the protocol or even who hands out the most rewards.

Liquidity Wars 3.0: Bribery Becomes a Market

2025/05/11 10:30
5 min read

Author: arndxt , Crypto KOL

Compiled by: Felix, PANews

The yield war may be on again. If you’ve been in DeFi long enough, you’ll understand that the total locked value (TVL) is just a vanity metric. Because in the competitive modular world of AMMs, perpetual contracts, and lending protocols, what really matters is who controls the flow of liquidity, not who owns the protocol, or even who issues the most rewards. It’s who can convince liquidity providers (LPs) to deposit funds and ensure that TVL remains stable. This is the origin of the bribe economy.

What were once informal ticket buying activities (Curve Wars, Convex, etc.) have now professionalized into full-fledged liquidity coordination markets, complete with order books, dashboards, incentivized routing layers, and even gamified participation mechanisms in some cases.

This is now becoming the most strategic layer in the entire DeFi stack.

Change: From issuance to meta-incentives

During 2021-2022, the protocol channeled liquidity in the traditional way:

  • Deploy a funding pool
  • Issuing Tokens
  • Hoping that profit-seeking LPs will stay after yields drop

But this model is fundamentally flawed: it is reactive. Every new agreement competes with an invisible cost: the opportunity cost of existing capital flows.

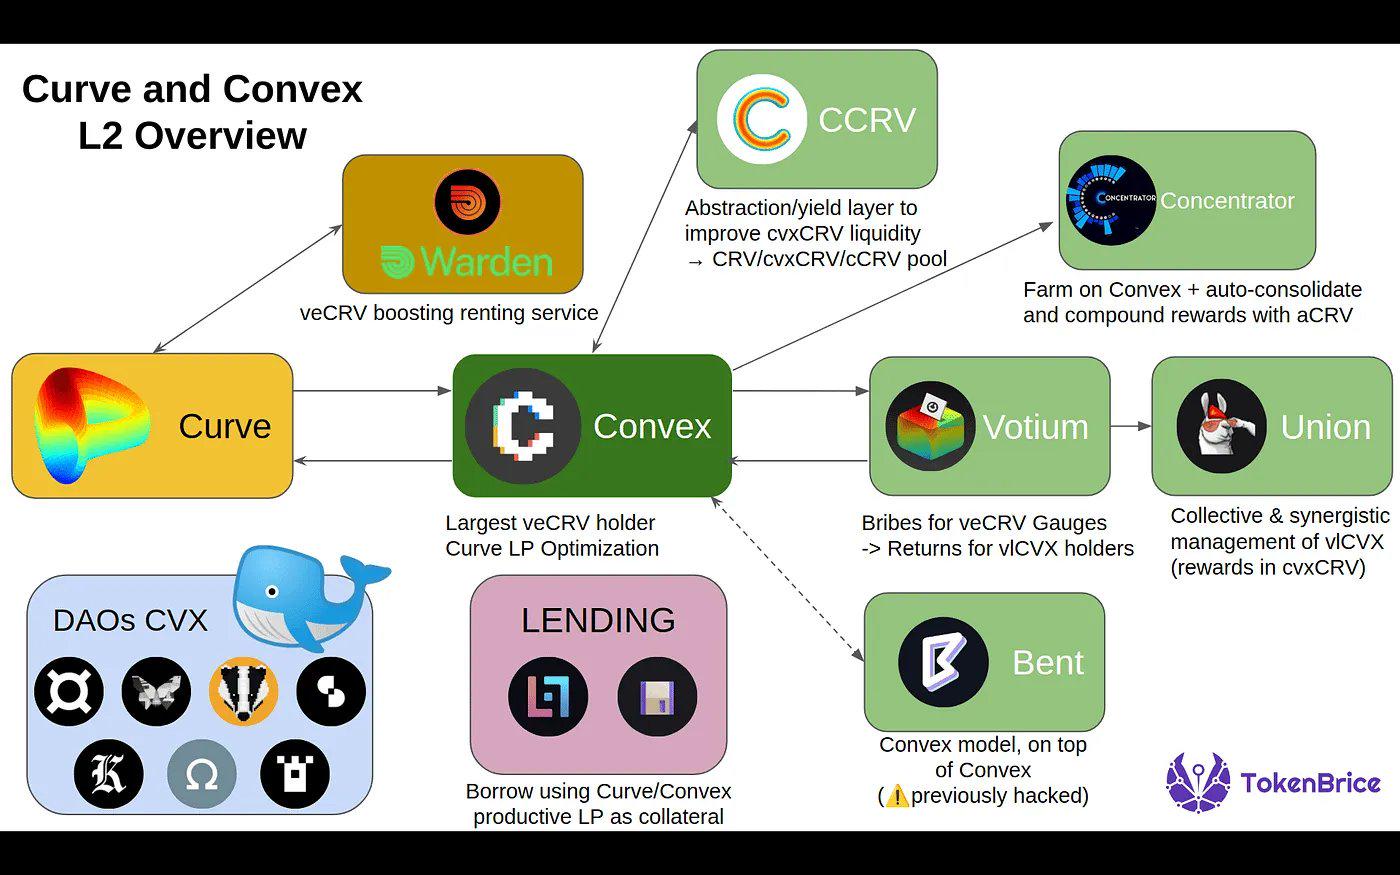
1. The Origin of the Yield War: Curve and the Rise of the Voting Market

The concept of the yield war began with the Curve battle in 2021 and gradually became concrete.

Curve Finance’s unique design

Curve introduced the voting custody (ve) token economics, where users can lock up CRV (Curve’s native token) for up to 4 years in exchange for veCRV, which gives users the following advantages:

  • Increase the rewards of Curve pool

  • Governance with voting weight (which pools get rewards)

This creates a meta-game around benefits:

  • Protocol hopes to gain liquidity on Curve

  • And the only way to get liquidity is to attract votes to their pool

  • So they started bribing veCRV holders to vote for

So Convex Finance came into being (a platform focused on increasing the returns of the Curve protocol):

  • Convex abstracts veCRV locking (simplifying the Curve usage process) and aggregates users’ voting power.

  • It has become the “King Maker of Curve” and has a huge influence on where CRV earnings go.

  • Projects began to bribe Convex/veCRV holders through platforms such as Votium.

Experience 1: Whoever controls the voting weight controls the liquidity.

Liquidity Wars 3.0: Bribery Becomes a Market

2. Meta-Incentives and Bribery Markets

The first bribe economy

What started as a manual process to influence issuance has evolved into a full-fledged marketplace where:

  • Votium becomes an OTC bribery platform for CRV issuance.
  • The emergence of Redacted Cartel, Warden, and Hidden Hand has expanded this model to other protocols such as Balancer and Frax.
  • Instead of simply paying issuance fees, protocols strategically allocate incentives to optimize capital efficiency.

Scaling Beyond Curve

  • Balancer adopts voting escrow mechanism through veBAL
  • Frax, Tokemak, and other protocols integrate similar systems
  • Incentivized routing platforms like Aura Finance and Llama Airforce add further complexity, turning issuance into a capital coordination game.

Lesson 2: Returns are no longer about annualized yield (APY), but about programmable meta-incentives.

3. How the revenue war unfolds

Here’s how protocols compete in this game:

  • Liquidity aggregation: Aggregate influence through wrappers like Convex (e.g. Aura Finance for Balancer)
  • Bribery campaign: Reserve a budget for ongoing vote-buying to attract issuance when needed
  • Game theory and token economics: locking tokens to establish long-term consistency (e.g. ve model)
  • Community incentives: gamify voting through NFTs, raffles, or reward airdrops

Today, protocols like Turtle Club and Royco are channeling this liquidity: instead of blindly issuing, incentives are auctioned to LPs based on demand signals.

Essentially: “You bring the liquidity, and we direct the incentives to where it’s needed most.”

This unlocks a second-order effect: protocols no longer need to forcibly acquire liquidity, but instead coordinate it.

Turtle Club

Turtle Club has quietly become one of the most effective bribery markets with little mention. Their pools are often embedded in partnerships, with a total value locked (TVL) of over $580 million, dual token issuance, weighted bribery, and a surprisingly sticky LP base.

Liquidity Wars 3.0: Bribery Becomes a Market

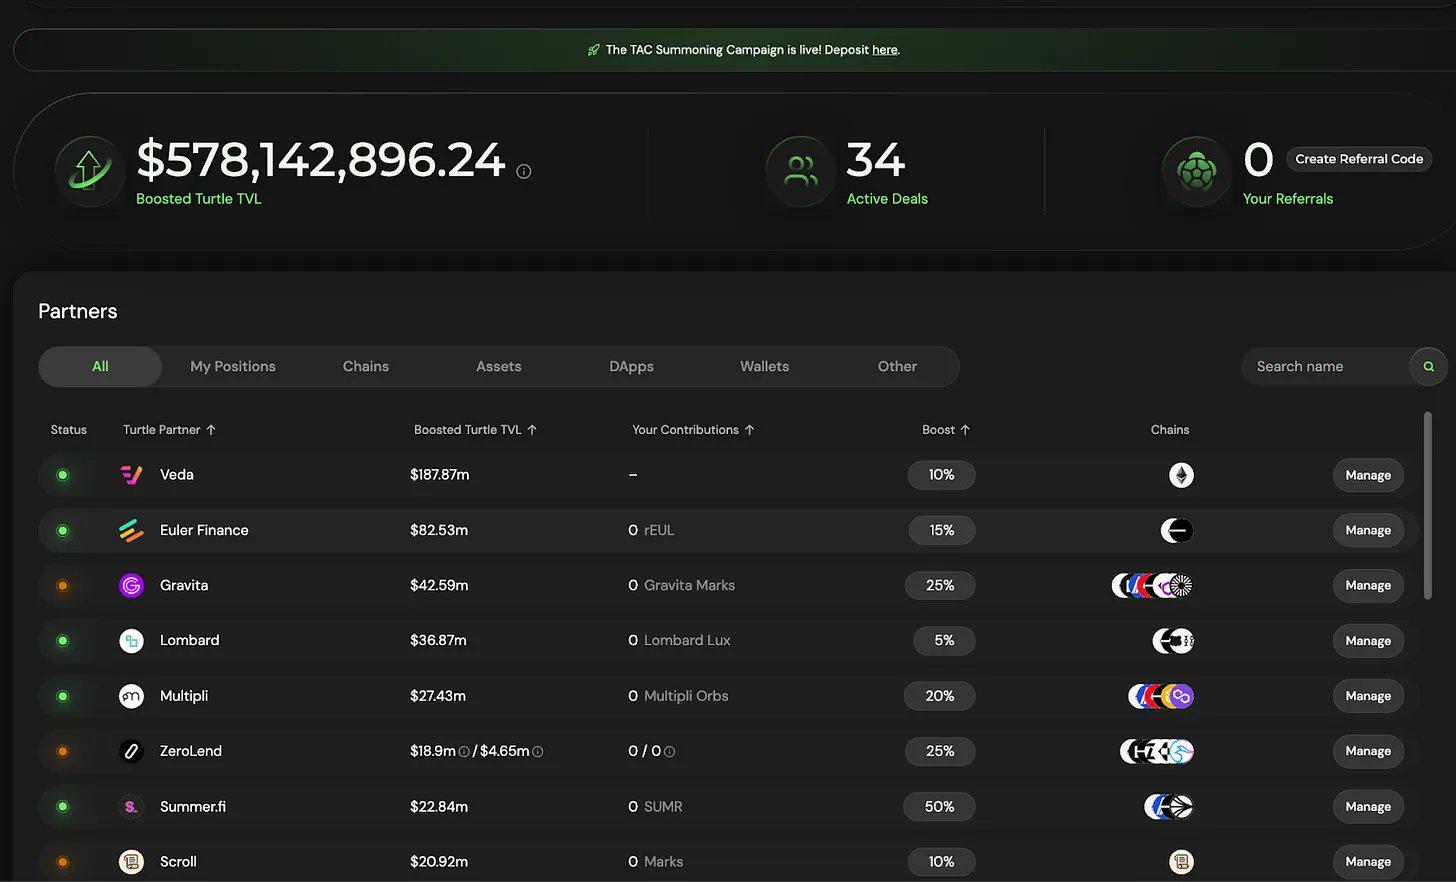
Their model emphasizes fair value redistribution, which means that the distribution of earnings is determined by voting and real-time capital turnover.

This is a smarter flywheel: LPs are rewarded with a correlation to the efficiency of their capital, not just the size of it. This time, efficiency is incentivized.

Royco

Royco’s total locked value (TVL) soared to over $2.6 billion in a single month, a 267,000% increase from the previous month.

Liquidity Wars 3.0: Bribery Becomes a Market

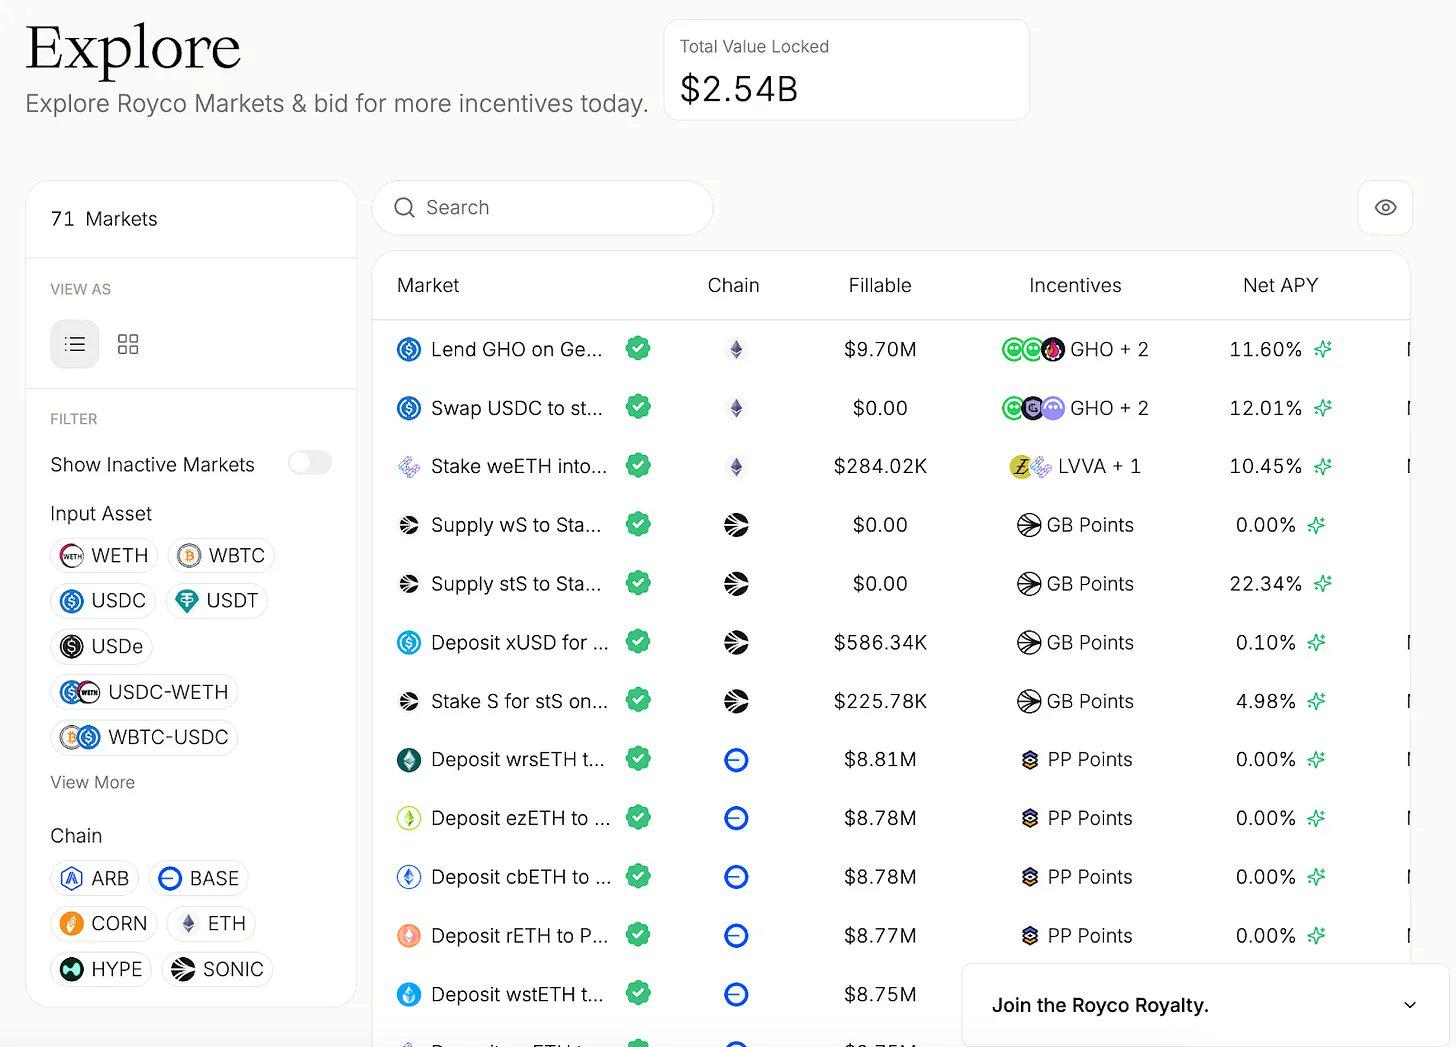
While some of this funding is “points driven”, what’s important is the infrastructure behind it:

  • Royco is a liquidity-preferred order book.
  • Protocols can’t just issue rewards and hope that capital comes in. They issue requests and LPs decide to invest, and this coordination forms a market.

Here’s what makes this narrative more than just a revenue play:

  • These markets are becoming the meta-governance layer for DeFi.
  • Hidden Hand has sent over $35 million in bribes between major protocols such as Velodrome and Balancer.
  • Royco and Turtle Club are shaping effective distribution solutions.

Liquidity coordination market mechanism

1. Bribery as a market signal

Programs like Turtle Club allow LPs to understand where incentives are flowing, make decisions based on real-time metrics, and be rewarded based on capital efficiency rather than just capital size.

2. Request for Liquidity (RfL) as an Order Book

Projects like Royco allow protocols to list liquidity needs, just like posting orders on the market, and LPs execute these orders based on expected returns.

This becomes a two-way coordination game rather than a one-sided bribe.

If you can decide where liquidity flows, you can influence who survives the next market cycle.

Related reading: Migration of on-chain liquidity: After 15 months of ups and downs, who remains standing after the hype subsides?

Market Opportunity
FLOW Logo
FLOW Price(FLOW)
$0.04895
$0.04895$0.04895
-0.58%
USD
FLOW (FLOW) Live Price Chart
Disclaimer: The articles reposted on this site are sourced from public platforms and are provided for informational purposes only. They do not necessarily reflect the views of MEXC. All rights remain with the original authors. If you believe any content infringes on third-party rights, please contact [email protected] for removal. MEXC makes no guarantees regarding the accuracy, completeness, or timeliness of the content and is not responsible for any actions taken based on the information provided. The content does not constitute financial, legal, or other professional advice, nor should it be considered a recommendation or endorsement by MEXC.

You May Also Like

Over 60% of crypto press releases linked to high-risk or scam projects: Report

Over 60% of crypto press releases linked to high-risk or scam projects: Report

A data analysis shows crypto press release wires are dominated by scam-linked projects, hype-driven content and low-impact announcements, raising concerns about
Share
Crypto.news2026/02/04 22:02
ArtGis Finance Partners with MetaXR to Expand its DeFi Offerings in the Metaverse

ArtGis Finance Partners with MetaXR to Expand its DeFi Offerings in the Metaverse

By using this collaboration, ArtGis utilizes MetaXR’s infrastructure to widen access to its assets and enable its customers to interact with the metaverse.
Share
Blockchainreporter2025/09/18 00:07
Crucial US Stock Market Update: What Wednesday’s Mixed Close Reveals

Crucial US Stock Market Update: What Wednesday’s Mixed Close Reveals

BitcoinWorld Crucial US Stock Market Update: What Wednesday’s Mixed Close Reveals The financial world often keeps us on our toes, and Wednesday was no exception. Investors watched closely as the US stock market concluded the day with a mixed performance across its major indexes. This snapshot offers a crucial glimpse into current investor sentiment and economic undercurrents, prompting many to ask: what exactly happened? Understanding the Latest US Stock Market Movements On Wednesday, the closing bell brought a varied picture for the US stock market. While some indexes celebrated gains, others registered slight declines, creating a truly mixed bag for investors. The Dow Jones Industrial Average showed resilience, climbing by a notable 0.57%. This positive movement suggests strength in some of the larger, more established companies. Conversely, the S&P 500, a broader benchmark often seen as a barometer for the overall market, experienced a modest dip of 0.1%. The technology-heavy Nasdaq Composite also saw a slight retreat, sliding by 0.33%. This particular index often reflects investor sentiment towards growth stocks and the tech sector. These divergent outcomes highlight the complex dynamics currently at play within the American economy. It’s not simply a matter of “up” or “down” for the entire US stock market; rather, it’s a nuanced landscape where different sectors and company types are responding to unique pressures and opportunities. Why Did the US Stock Market See Mixed Results? When the US stock market delivers a mixed performance, it often points to a tug-of-war between various economic factors. Several elements could have contributed to Wednesday’s varied closings. For instance, positive corporate earnings reports from certain industries might have bolstered the Dow. At the same time, concerns over inflation, interest rate policies by the Federal Reserve, or even global economic uncertainties could have pressured growth stocks, affecting the S&P 500 and Nasdaq. Key considerations often include: Economic Data: Recent reports on employment, manufacturing, or consumer spending can sway market sentiment. Corporate Announcements: Strong or weak earnings forecasts from influential companies can significantly impact their respective sectors. Interest Rate Expectations: The prospect of higher or lower interest rates directly influences borrowing costs for businesses and consumer spending, affecting future profitability. Geopolitical Events: Global tensions or trade policies can introduce uncertainty, causing investors to become more cautious. Understanding these underlying drivers is crucial for anyone trying to make sense of daily market fluctuations in the US stock market. Navigating Volatility in the US Stock Market A mixed close, while not a dramatic downturn, serves as a reminder that market volatility is a constant companion for investors. For those involved in the US stock market, particularly individuals managing their portfolios, these days underscore the importance of a well-thought-out strategy. It’s important not to react impulsively to daily movements. Instead, consider these actionable insights: Diversification: Spreading investments across different sectors and asset classes can help mitigate risk when one area underperforms. Long-Term Perspective: Focusing on long-term financial goals rather than short-term gains can help weather daily market swings. Stay Informed: Keeping abreast of economic news and company fundamentals provides context for market behavior. Consult Experts: Financial advisors can offer personalized guidance based on individual risk tolerance and objectives. Even small movements in major indexes can signal shifts that require attention, guiding future investment decisions within the dynamic US stock market. What’s Next for the US Stock Market? Looking ahead, investors will be keenly watching for further economic indicators and corporate announcements to gauge the direction of the US stock market. Upcoming inflation data, statements from the Federal Reserve, and quarterly earnings reports will likely provide more clarity. The interplay of these factors will continue to shape investor confidence and, consequently, the performance of the Dow, S&P 500, and Nasdaq. Remaining informed and adaptive will be key to understanding the market’s trajectory. Conclusion: Wednesday’s mixed close in the US stock market highlights the intricate balance of forces influencing financial markets. While the Dow showed strength, the S&P 500 and Nasdaq experienced slight declines, reflecting a nuanced economic landscape. This reminds us that understanding the ‘why’ behind these movements is as important as the movements themselves. As always, a thoughtful, informed approach remains the best strategy for navigating the complexities of the market. Frequently Asked Questions (FAQs) Q1: What does a “mixed close” mean for the US stock market? A1: A mixed close indicates that while some major stock indexes advanced, others declined. It suggests that different sectors or types of companies within the US stock market are experiencing varying influences, rather than a uniform market movement. Q2: Which major indexes were affected on Wednesday? A2: On Wednesday, the Dow Jones Industrial Average gained 0.57%, while the S&P 500 edged down 0.1%, and the Nasdaq Composite slid 0.33%, illustrating the mixed performance across the US stock market. Q3: What factors contribute to a mixed stock market performance? A3: Mixed performances in the US stock market can be influenced by various factors, including specific corporate earnings, economic data releases, shifts in interest rate expectations, and broader geopolitical events that affect different market segments uniquely. Q4: How should investors react to mixed market signals? A4: Investors are generally advised to maintain a long-term perspective, diversify their portfolios, stay informed about economic news, and avoid impulsive decisions. Consulting a financial advisor can also provide personalized guidance for navigating the US stock market. Q5: What indicators should investors watch for future US stock market trends? A5: Key indicators to watch include upcoming inflation reports, statements from the Federal Reserve regarding monetary policy, and quarterly corporate earnings reports. These will offer insights into the future direction of the US stock market. Did you find this analysis of the US stock market helpful? Share this article with your network on social media to help others understand the nuances of current financial trends! To learn more about the latest stock market trends, explore our article on key developments shaping the US stock market‘s future performance. This post Crucial US Stock Market Update: What Wednesday’s Mixed Close Reveals first appeared on BitcoinWorld.
Share
Coinstats2025/09/18 05:30