The AI boom looks like dot-com mania, but Bitcoin bulls have one profitable reason to keep buying
Bitcoin’s macro setup is increasingly tied to the same forces driving the S&P 500 to new highs: liquidity, concentration, rate expectations, and investor tolerance for stretched valuations.
The current S&P 500 structure shows an index still moving in a powerful long-term uptrend, with price near 7,365 on the weekly chart, while valuation indicators sit in historically elevated territory.
That combination creates a constructive backdrop for Bitcoin in the near term, with a clear condition attached.
BTC benefits while the equity trend remains intact.
Fragility rises if expensive equities begin to roll over under the weight of rates, earnings pressure, or volatility.
The current market regime is best understood through the three layers of the S&P 500 chart below.
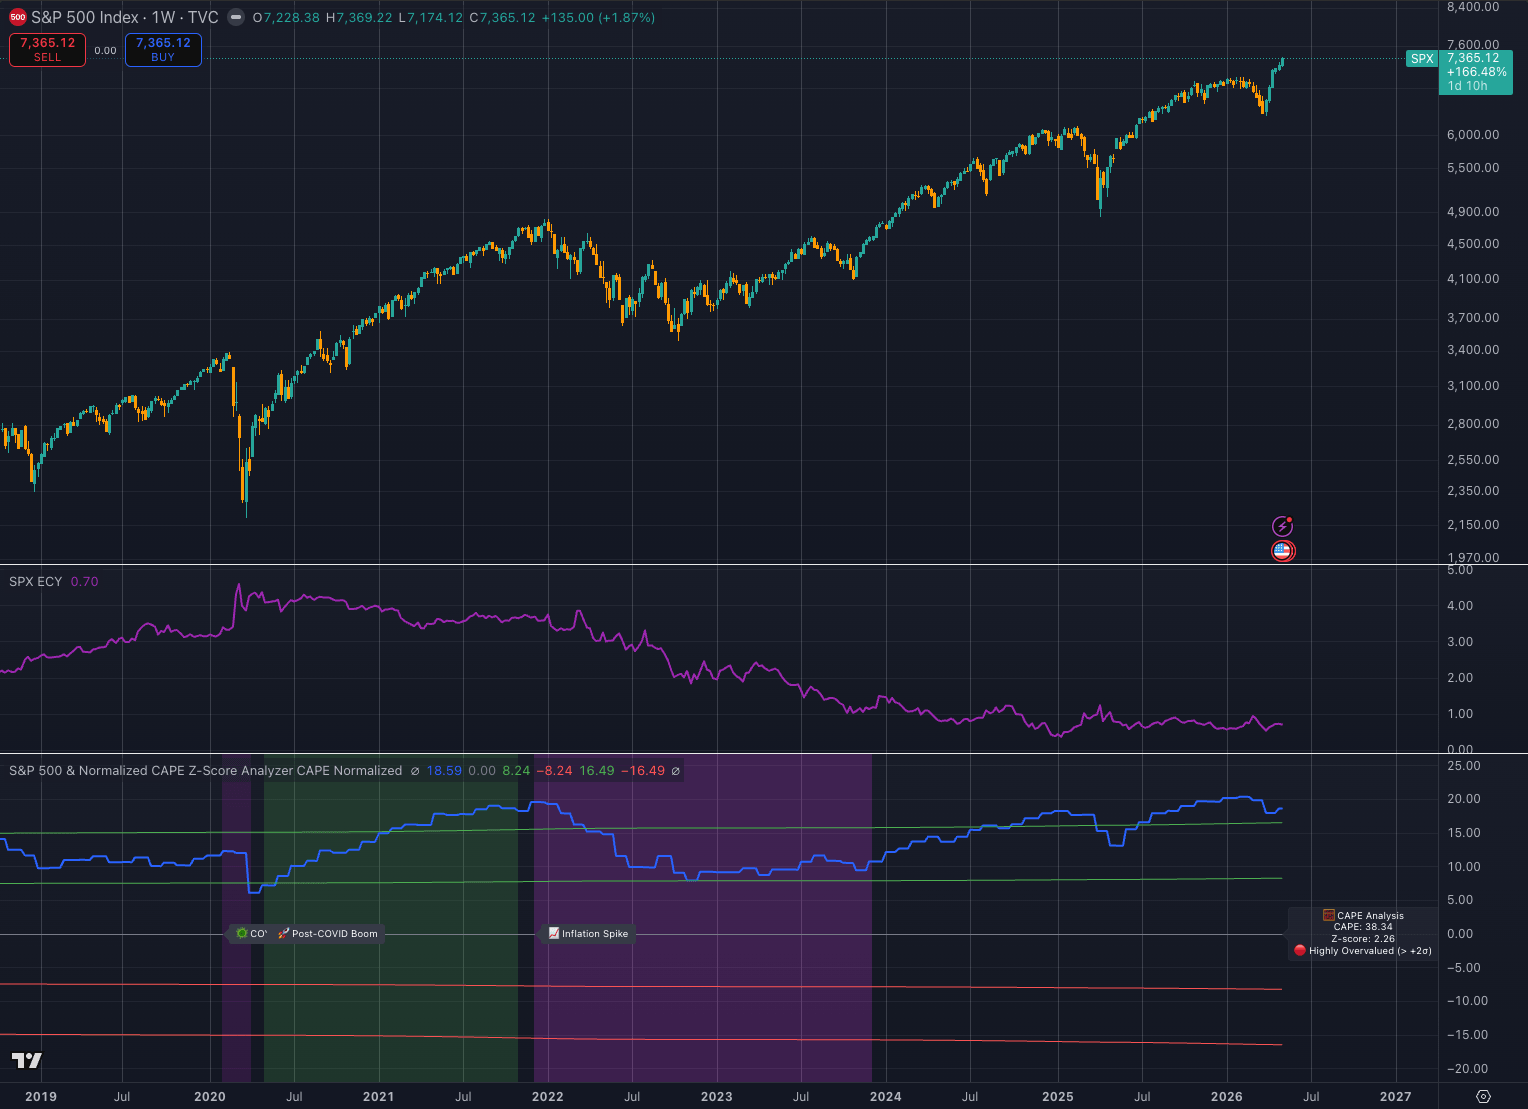 S&P 500 performance since 2019
The first layer is price.
The index remains in a secular advance, with higher highs and higher lows surviving the dot-com crash, the global financial crisis, the COVID shock, the 2022 tightening cycle, and the latest phase of AI-led equity concentration.
The second layer is the equity risk premium-style signal, shown by the SPX ECY reading near 0.70.
That level suggests investors are accepting less compensation for holding equities relative to the rate environment.
The third layer is valuation.
The normalized CAPE Z-score analyzer shows a CAPE reading around 38.34 and a Z-score near 2.26, placing the market in a zone the chart labels as highly overvalued.
Independent CAPE datasets, including the Shiller PE ratio, show the same broad context: U.S. equities are expensive compared with long-run history.
For Bitcoin, the conclusion is direct.
The current equity setup remains supportive for high-beta assets as long as investors keep treating expensive valuations as a feature of a durable growth regime.
BTC sits further out on the risk curve than the S&P 500 and Nasdaq.
When macro confidence expands, Bitcoin usually receives the amplified version of that capital flow.
When macro confidence contracts, Bitcoin usually absorbs the amplified version of the drawdown.
Equity valuations are stretched while the trend still supports Bitcoin’s risk appetite
The S&P 500 chart shows a market that has become expensive while maintaining trend control.
That distinction is central for Bitcoin.
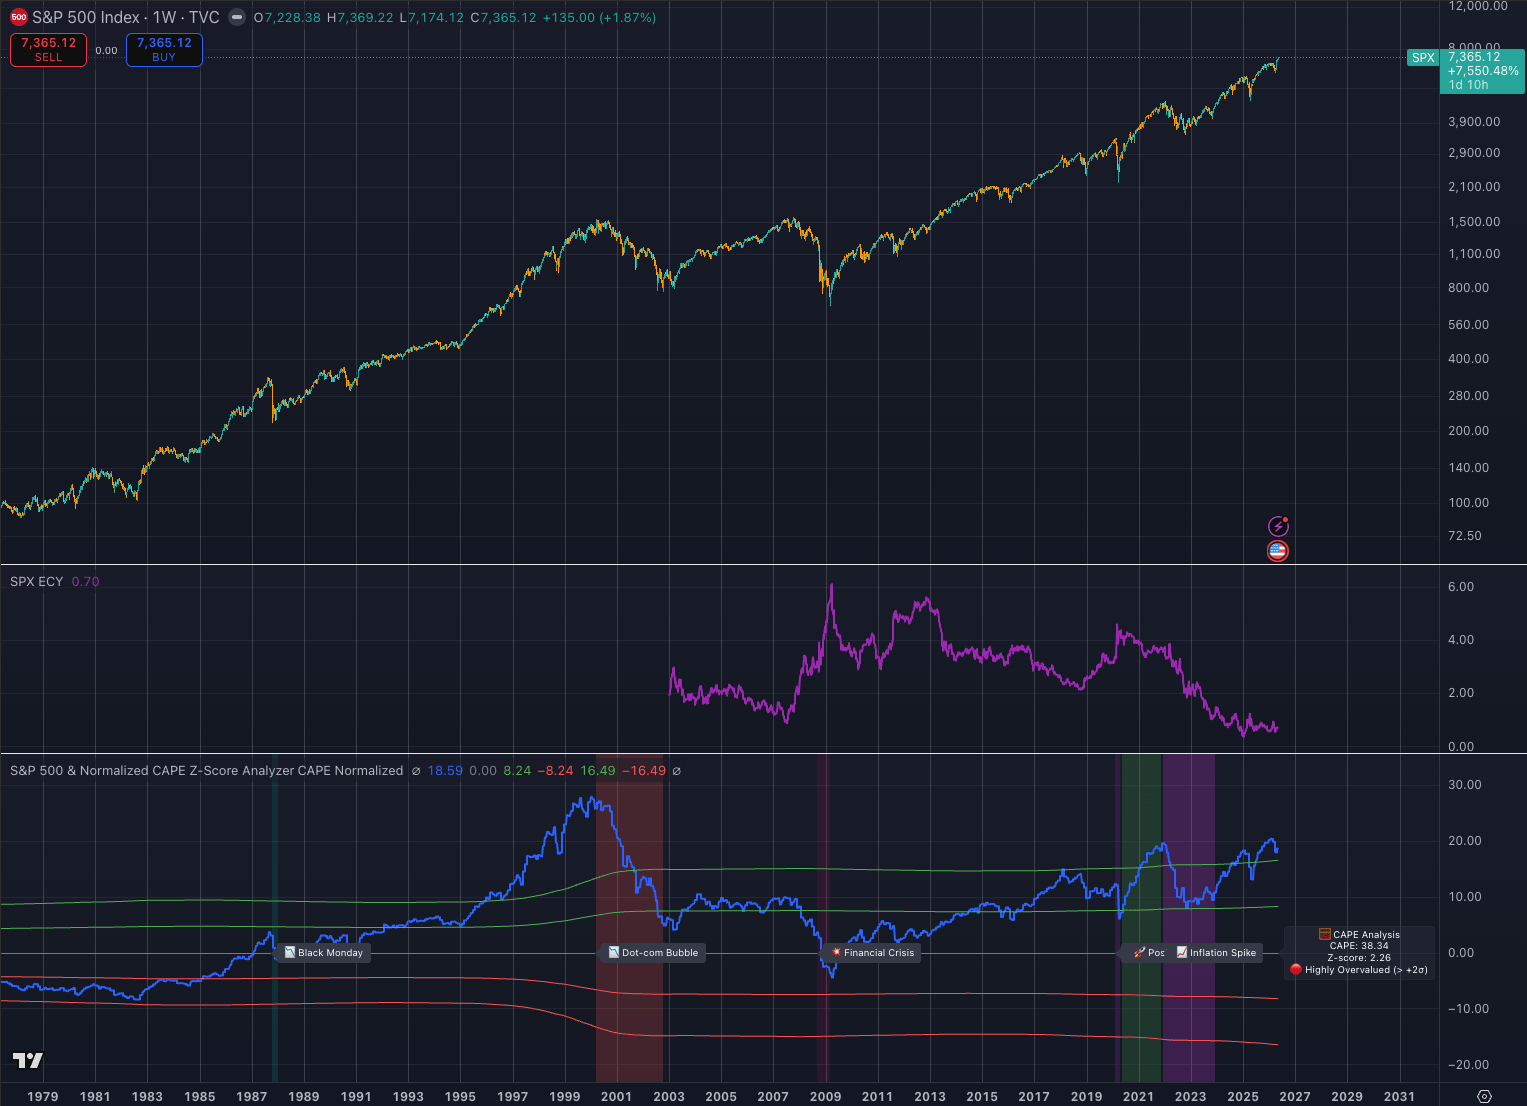 S&P 500 performance since 1979
Expensive markets can keep rising for long periods when earnings, liquidity, and narrative strength remain aligned.
The late 1990s showed how far a technology-led cycle can run before valuation discipline returns.
The 2020 and 2021 cycles showed how far risk assets can move when liquidity expansion, falling real yields, and speculative capital combine.
The 2022 cycle showed the other side of the framework, when higher rates compress duration assets and expose crowded positioning.
The current setup borrows from all three periods.
As in the dot-com era, leadership is concentrated around a transformational technology theme. I even highlighted the comparison and potential red flag in a recent article.
In the late 1990s, the internet provided the dominant justification for higher multiples.
Today, AI plays that role.
The index has become increasingly dependent on a small group of mega-cap technology companies, with the so-called Magnificent Seven accounting for a large share of S&P 500 performance and index weight.
That concentration gives the index strong upside when leadership works.
It also narrows the margin for error if leadership weakens.
However, today’s leaders have large revenue bases, high margins, and significant free cash flow, which gives the current equity cycle a stronger earnings foundation than the speculative internet bubble.
Even so, the operational market signal is still late-cycle in character.
The S&P 500 is rising while valuation support is thin, risk premium compensation is compressed, and the index is leaning heavily on the market’s confidence in future productivity gains.
Bitcoin tends to perform well in precisely that kind of environment.
When equity investors accept valuation stretch in exchange for future growth, crypto investors often move even further along the same curve.
That is why the current S&P 500 setup is constructive for BTC rather than immediately bearish.
The chart shows a market priced for execution.
Bitcoin thrives when execution risk is underpriced, liquidity remains available, and investors believe the next phase of growth will justify today’s valuation premium.
In that regime, BTC behaves less like a defensive hedge and more like a high-beta expression of macro confidence.
The near-term implication is therefore positive.
If the S&P 500 continues to hold its weekly trend, volatility remains contained, and AI-led earnings expectations continue to attract institutional capital, Bitcoin should remain supported.
A rising equity market at elevated valuations can still pull BTC higher because allocators become more willing to pursue convexity.
Bitcoin’s upside in that setting can exceed the equity move because it has a smaller capital base, stronger reflexivity, and a more direct link to liquidity expectations.
Bitcoin now trades through the same liquidity channel as high-beta technology
Bitcoin’s sensitivity to equities has changed over time.
Earlier cycles were more isolated, driven by halving narratives, offshore leverage, crypto-native liquidity, exchange flows, and retail speculation.
Those forces still exist, but the institutional market structure is larger now.
The approval of spot Bitcoin exchange-traded products in January 2024 by the SEC changed the access layer.
BTC became easier to hold inside conventional portfolios, easier to model as a macro allocation, and easier to trade as part of a broader risk basket.
That shift has two consequences.
First, Bitcoin has a stronger structural demand channel than in prior cycles because ETF access brings a deeper pool of potential buyers.
Second, Bitcoin is more exposed to the same macro variables that drive institutional portfolios.
The same investors who use the S&P 500, Nasdaq, gold, Treasury futures, and volatility products to express macro views can now use spot Bitcoin ETFs in the same allocation stack.
That makes BTC more liquid, more legitimate, and more tied to cross-asset conditions.
The S&P 500 valuation signal therefore becomes relevant for Bitcoin because it shows where risk appetite sits in the broader portfolio system.
A CAPE reading near 38 and a Z-score above 2 place equities in rare valuation territory.
That does not trigger an automatic sell signal.
It reduces the market’s tolerance for disappointment.
At these levels, investors need earnings to validate price, rates to avoid renewed pressure, and liquidity to remain available.
Bitcoin benefits if those conditions hold.
Vulnerability rises if one of those supports weakens.
The rate channel is especially important.
Bitcoin performs best when real yields fall, liquidity expands, and the opportunity cost of holding non-yielding assets declines.
The Federal Reserve’s target-rate framework, visible through data series such as the Federal Funds Target Range, remains a central input for every duration-sensitive asset.
When markets expect easier policy, BTC often rallies before the easing arrives.
When policy stays restrictive for longer, speculative assets lose some of their valuation support.
The current equity chart shows that risk assets have been able to climb despite a higher-rate regime.
That is an important signal.
It suggests investors are treating earnings strength, AI-related capital expenditure, and future productivity as strong enough to offset the drag from rates.
Bitcoin interprets that environment as permissive.
BTC does not need zero rates to rise if capital is still flowing into high-conviction growth themes and if institutional investors continue looking for assets with asymmetric upside.
ETF access strengthens Bitcoin’s upside while tying it more tightly to macro stress
BTC can remain constructive even with stretched equities because the market is no longer in the pure 2020 and 2021 liquidity regime, when stimulus and ultra-low rates overwhelmed almost every other input.
The current setup is more selective.
Capital is rewarding assets that sit at the intersection of scarcity, technology, liquidity, and institutional adoption.
Bitcoin qualifies for that framework.
Its risk is that the same institutional adoption making it more credible also makes it easier to sell when portfolio managers reduce risk across the board.
The chart’s historical markers provide a useful framework for Bitcoin.
The dot-com period shows how technology narratives can push valuations far beyond conventional comfort levels before the cycle exhausts itself.
The 2008 financial crisis shows how valuation and leverage can become dangerous when the underlying financial system breaks.
The 2020 and 2021 periods show how liquidity can send Bitcoin dramatically higher when risk appetite broadens.
The 2022 inflation shock shows how quickly BTC can reprice when rates rise, liquidity tightens, and investors stop paying premium multiples for long-duration assets.
The current environment is closest to a blend of dot-com concentration, post-COVID risk appetite, and post-2022 rate discipline.
That blend is unusual.
Equities are expensive, but the index is still advancing.
Rates remain higher than the zero-rate era, but investors are still willing to buy growth.
AI has replaced emergency liquidity as the primary justification for elevated valuations.
Bitcoin has replaced purely retail-driven speculation with a more institutional demand channel.
That points to a constructive Bitcoin outlook while the S&P 500 trend remains intact.
If equities continue rising, BTC likely attracts capital for three reasons.
- Investors become more comfortable moving outward on the risk curve.
- Bitcoin offers a more convex expression of liquidity confidence than large-cap equities.
- The structural ETF channel allows institutional flows to reach BTC without the operational friction that defined earlier cycles.
The most important market signal is whether the S&P 500 remains expensive and trending, or expensive and failing.
The first condition supports Bitcoin.
The second condition threatens it.
A weekly SPX trend that keeps pushing into highs signals that investors are still willing to absorb valuation risk.
A failed breakout, narrowing breadth, rising volatility, and weakness in AI leadership would change the signal.
Bitcoin would then be less likely to trade as digital gold and more likely to trade as liquid high beta.
Bitcoin remains constructive while equity momentum holds
That behavior has precedent.
In March 2020, BTC sold off during the liquidity shock before later becoming one of the strongest beneficiaries of the policy response.
In 2022, Bitcoin declined sharply as the inflation shock and Fed tightening cycle compressed speculative assets.
In late 2020 and early 2021, BTC outperformed equities as liquidity expansion pushed capital into the most reflexive assets.
These episodes show that Bitcoin’s long-term scarcity narrative can coexist with short-term macro liquidation.
In stress, liquidity comes first.
For now, the chart favors continuation rather than immediate defensive positioning.
The S&P 500’s price structure remains bullish.
Valuations are extended, but extension alone rarely ends a cycle.
The market needs a catalyst that turns stretched valuation into active repricing.
That catalyst could come from earnings disappointment, renewed inflation pressure, a higher-for-longer Fed path, credit stress, or an unwind in mega-cap AI leadership.
Until that catalyst appears, Bitcoin has room to keep benefiting from the same macro confidence lifting equities.
The practical signal is that BTC remains in a favorable but fragile regime.
The bullish case is strongest while SPX holds trend, volatility stays contained, and liquidity expectations remain stable or improve.
In that environment, Bitcoin can outperform because it sits at the high-beta end of the same risk spectrum.
The risk case begins when the S&P 500 stops treating high valuations as sustainable and starts repricing them as a vulnerability.
Until then, the equity chart points to continued appetite for risk, and Bitcoin is one of the clearest beneficiaries of that appetite.
The post The AI boom looks like dot-com mania, but Bitcoin bulls have one profitable reason to keep buying appeared first on CryptoSlate.


You May Also Like

XRP Market Now Controlled By Whales? Dominance Reaches 91% On Binance

Vitalik Buterin gets sandwiched by ‘JaredfromSubway’ as Ethereum MEV risks linger