

SUI Price Today: Sui at $1.20 After 27% Weekly Surge From $0.94 – Can It Hold the Breakout?

Sui is trading near $1.20 on May 12, 2026, after one of its biggest weekly moves in months. The CoinMarketCap 1W chart shows it clearly: SUI ground slowly higher from the $0.9471 weekly open, then exploded on May 10 to 11 on the back of two concrete catalysts, touching a high near $1.40 before the current pullback.
From $0.94 to $1.40 is a 48% move. Giving back some of that to $1.20 is not a surprise. The question is whether $1.20 holds or whether this week’s candle becomes a shooting star that gets fully unwound.
What Drove the Move
Two things hit on May 9 to 10 and the chart responded immediately to both.
A Nasdaq-listed company disclosed it had staked a significant portion of SUI’s circulating supply. Institutional staking at that scale removes tokens from liquid supply and sends a public signal that a regulated entity is making a long-term bet. Price jumped 13% on that news alone.
The same day, at the Sui Live event in Miami, Nigerian fintech Paga announced a deep integration with the Sui blockchain using the USDsui stablecoin to offer dollar accounts, tokenized real-world assets, and cross-border payments to its user base. Paga processed $11 billion in 2025. That is real volume, not a pilot.
The combination pushed SUI through the $1.05 resistance that had been holding for weeks, through $1.10, through $1.20, all the way to $1.40 in about 36 hours.
SUI/USD Chart: $1.20 Is the Level to Hold
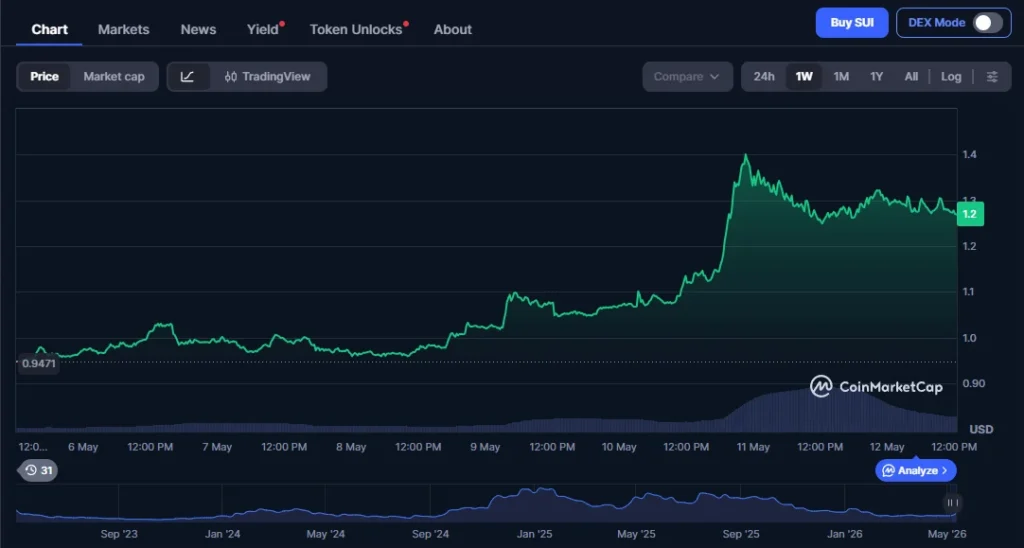 SUI/USD 1W chart showing the surge from $0.9471 to $1.40 and the pullback to $1.20. Source: CoinMarketCap.
The 200-day EMA sits at $1.43, just above the weekly high. SUI has not closed above it, which means the macro trend is still technically under pressure from that measure.
What the chart does show is a clean breakout above $1.05, the level that had capped SUI for most of April. That breakout needs to hold. A weekly close above $1.20 keeps the structure intact and sets up a retest of $1.35 to $1.40.
RSI is at 75.5, overbought territory. That does not mean price crashes from here, but it does mean the easy part of the move is done. Pullbacks from RSI readings above 70 are historically more common than continuations without consolidation first.
On the downside, $1.10 is the first support worth watching. Below that, $0.9580 is the major base that SUI was sitting at before this week’s move. A drop back to that level would erase most of the week’s gains and suggest the catalysts were priced in rather than the start of something bigger.
What Could Extend the Move
Three structural developments support SUI beyond this week’s news.
The Sui network processed over $1 trillion in stablecoin volume in May 2026, a milestone that puts it in genuine competition with established payment rails. CME Group SUI futures launched May 4, pending regulatory approval, adding institutional-grade access. The 21shares TSUI ETF has been trading on Nasdaq since February 24, providing a regulated on-ramp that pulls float off exchanges.
The headwind that has not changed: monthly token unlocks. Only 4 billion of the 10 billion maximum supply is circulating. Unlock events through 2030 add consistent sell pressure, and when momentum fades, unlocks tend to drag price lower faster than the fundamental story can offset.
Key Levels
Support: $1.20 / $1.10 / $0.9580 Resistance: $1.35 / $1.40 / $1.43 (200-day EMA)
Bottom Line
SUI had a strong week. The catalysts were real and the move from $0.94 to $1.40 reflects genuine demand rather than pure leverage noise. The pullback to $1.20 is normal after a 48% run.
Hold $1.20 on a weekly close and $1.35 to $1.40 comes back into view. Lose it and the breakout needs to reset from lower levels. The 200-day EMA at $1.43 is the real ceiling that has not been cleared yet.
Cautiously bullish. The setup is better than it has been all year, but RSI at 75 says the next leg needs time to breathe first.
This article is for informational purposes only and does not constitute financial advice.


You May Also Like

Zcash Price Prediction After Grayscale Files First-Ever Spot Privacy Coin ETF

EUR/GBP Exchange Rate Surges as Bank of England Rate Hike Expectations Intensify – Market Analysis


