BNB Monthly Chart Signals Third Major Accumulation Zone For Bulls
BNB monthly chart signals a third accumulation zone as price trades near $649 after pulling back from $690 resistance.
BNB traded near $649.48 as traders reviewed a monthly chart setup described as a third major accumulation zone.
The view came as BNB pulled back from recent resistance, while long-term targets remained part of the technical discussion.
BNB Pulls Back After Recent High
BNB traded near $649.48 on the daily Binance chart, down 0.63% during the session. The candle showed an open near $649.48 and a close near $645.38.
The daily high stood near $649.70, while the low reached $634.30. The move followed a recent push toward $689.98, which now acts as short-term resistance.
A daily close above $690 would show stronger buyer demand. Until then, BNB remains in a pullback after its early May advance.
The price stayed below the MA(7) near $662.61. This shows near-term selling pressure, even as broader moving averages remain supportive.
Monthly Chart Shows Accumulation View
A market analyst said BNB is forming a third major accumulation zone on the monthly chart. The note described the zone as part of a long-term technical setup.
The same note said earlier setups were followed by gains of 665%, 11,200%, and 565%. These figures were presented as past technical outcomes, not future results.
The market analyst stated, “One day you’ll wish you had bought BNB between $500–$300.” It also listed long-term targets at $2,000, $5,000, and $10,000.
The post described the view as “TA Only” and said it was not financial advice. It also advised traders to do their own research.
The $500 to $300 range remains below the current market price. A move into that area would require a deeper correction from present levels.
Read Also:
Moving Averages Keep Structure In Focus
BNB remained above the MA(25) near $641.78 and the MA(99) near $629.01. These levels are important for the short-term chart structure.
Immediate support sits near $641 to $645. This area includes the current price zone and the MA(25).
If BNB loses this range, the next support sits near $629. That level aligns with the MA(99) and may guide the next market reaction.
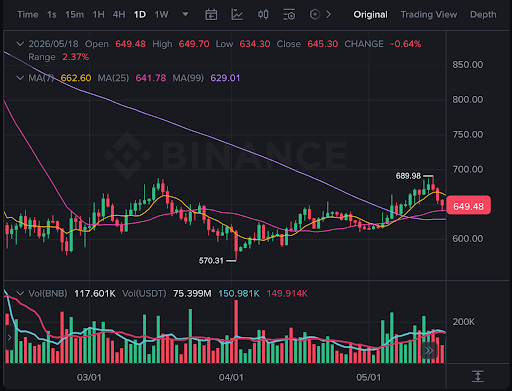 BNB pulls back below $690 resistance as support holds. Source: Binance
A deeper pullback could bring the $600 to $610 range into focus. That area would matter if sellers push prices below the main moving averages.
The broader daily trend improved from the April low near $570.31. Since then, BNB formed higher lows and moved above a descending trendline.
Volume increased during the early May rally. The latest red candles suggest profit-taking after the move toward $690.
BNB remains in a short-term pullback within a recovering daily structure. Holding above $641 may support another test of $662 and $690.
A close below $629 would weaken the setup. It could also bring renewed attention to the $600 support region.
The post BNB Monthly Chart Signals Third Major Accumulation Zone For Bulls appeared first on Live Bitcoin News.


You May Also Like

Analog Devices (ADI) Pursues $1.5 Billion Acquisition of Empower Semiconductor

Why Businesses Need Professional Machine Design and Development Services