

Tesla Stock Holds Uptrend as SpaceX-IPO Chatter Tests $431–$435

Tesla Stock remains in a constructive daily uptrend, though short-term momentum has cooled. While the 431–435 area holds, the path of least resistance stays higher; however, SpaceX-IPO chatter could complicate near-term tape as TSLA tests resistance.
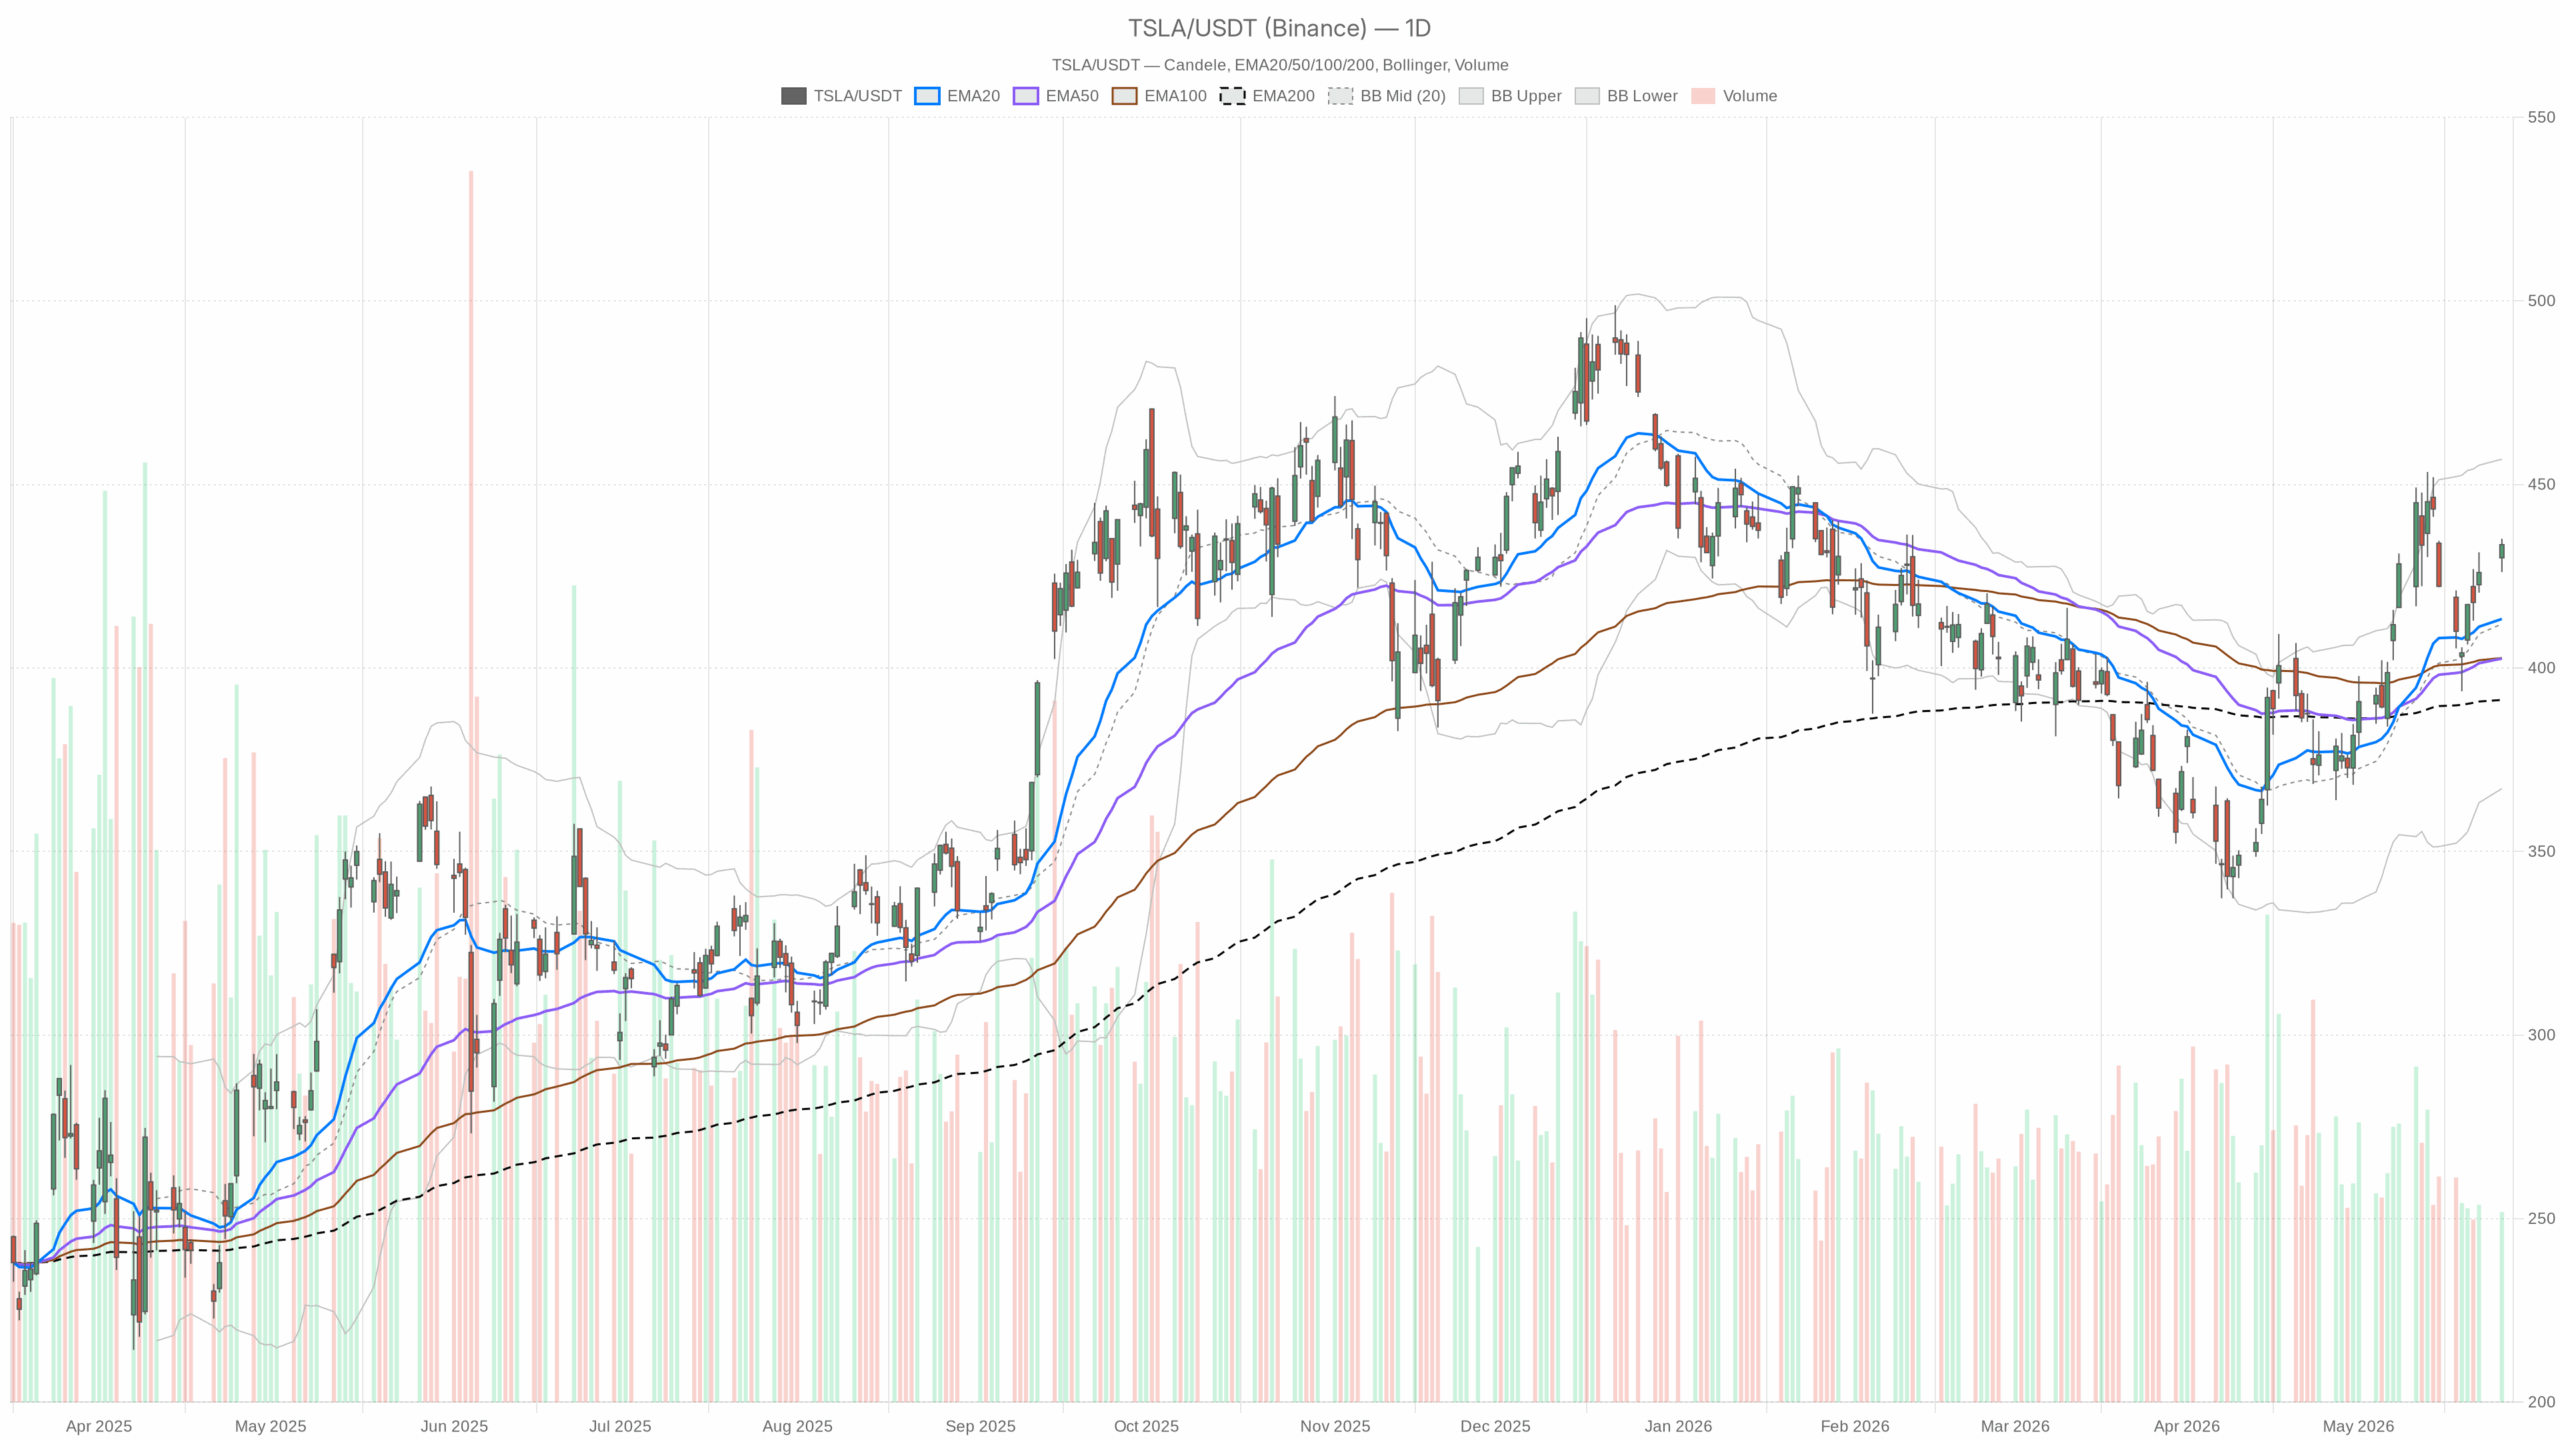 TSLA — daily chart with candlesticks, EMA20/EMA50 and volume.
Daily uptrend in Tesla Stock: indicators and structure
Trend and momentum
On the daily chart, TSLA closed at 433.59, above all key moving averages. The EMA20 sits at 413.36, the EMA50 at 402.56, and the EMA200 at 391.28. Stacked, rising EMAs support a bullish primary trend and encourage dip-buying.
Meanwhile, RSI14 prints 60.86. That reflects positive momentum without an overbought squeeze. The MACD shows line 10.7, signal 10.8, and histogram −0.1. Momentum is flattening after a run, so follow-through may require fresh catalysts.
Volatility and levels
Bollinger Bands show a mid at 412, an upper at 456.88, and a lower at 367.13. Price trades in the upper half with room toward the top band. However, bands are wide, implying bigger swings.
ATR14 is 17.92, signaling elevated daily volatility. The daily pivot is 431.64 with R1 437.15 and S1 428.07. Price settled above the pivot and below R1, putting 437.15 as the next topside checkpoint. Regime: bullish; the higher-timeframe bias remains up.
Intraday alignment supports TSLA bulls
1H trend and momentum
On the 1H chart, the last close was 433.56, above the EMA20 426.51, EMA50 422.44, and EMA200 406.8. Therefore, intraday trend support is firm and buyers are defending pullbacks. RSI14 stands at 63.63, showing control without a blow-off. The MACD reads line 4.22, signal 3.63, histogram 0.59, indicating positive, building momentum.
Notably, Bollinger on 1H shows a mid at 426.12 with an upper band at 437.15 and a lower at 415.08. ATR14 is 5.27, so hourly ranges are active. The 1H pivot sits at 432.96 with R1 435.05 and S1 431.47. Clearing 435.05 would strengthen the intraday breakout.
15m execution context
On the 15m chart, price closed 433.56 with EMA20 431.59, EMA50 428.71, and EMA200 423.73. The micro-trend remains up, supporting buy-the-dip tactics. RSI14 reads 58.6, which is constructive, not stretched. The MACD prints line 1.11, signal 1.18, histogram −0.08, pointing to a brief pause or micro consolidation.
Meanwhile, Bollinger Bands show a mid at 431.83 and an upper band at 434.93. Minor mean reversion is possible before any next leg. ATR14 is 1.93, so short-term swings can test nearby levels. The 15m pivot is 433.49 with R1 434.53 and S1 432.52, framing a tight 432.5–434.5 range for entries and stops. Regime: bullish.
Options flow and SpaceX IPO chatter: near-term wildcard
Notably, options flow has leaned bullish. A Yahoo Finance report flagged unusual call volume at at-the-money strikes, with activity far above normal. Sentiment has improved, which can fuel pull-in buyers on small dips. However, multiple reports on a potential SpaceX IPO raise a different risk.
The Motley Fool noted that investors could sell Tesla Stock to raise capital for that listing. A high-profile IPO can trigger rotation and near-term supply in TSLA, even inside a healthy trend. Therefore, headline risk may temporarily distort otherwise supportive technicals.
Levels and scenarios for Tesla Stock
Therefore, the constructive path is clear. Holding above the 431–433 area keeps bulls in charge. That zone aligns with the daily pivot at 431.64, the 1H pivot at 432.96, and the 15m pivot at 433.49. A clustered support shelf often attracts dip buyers.
A push through 435.05 (1H R1) would open 437.15 (daily R1 and 1H upper band). Breaking those levels would re-accelerate trend momentum and could pull price toward the daily upper band at 456.88 on extension.
On the other hand, losing 431–432 and then 428.07 (daily S1) would dent the structure. With ATR14 17.92, routine swings can reach the EMA20 413.36 or the Bollinger mid near 412. That shift would signal deeper mean reversion and would invalidate the near-term bullish case. Moreover, the flat daily MACD histogram warns that momentum can slip if sellers press into weak liquidity.
Bias and risk framework
Overall, the daily bias is bullish, the 1H confirms it, and the 15m shows a mild pause near resistance. Positioning should respect elevated volatility and the 431–435 battleground. Meanwhile, SpaceX-IPO headlines may inject flow-driven noise. Bias: cautiously bullish while 431 holds, with an eye on 435–437 for confirmation and 428 as the first warning line.


You May Also Like

The Champion Mindset: Why Discipline, Trust, and Structure Matter in Modern Trading

Temu Owner PDD (PDD) Stock Drops After Profit Comes in Way Below Estimates

XRP Faces Further Downside Risk as Liquidity Drops to 2020 Lows, Sentiment Turns Fearful



