

Nokia Stock Nears Resistance as 140% Rally Hits Overbought Levels

Nokia Stock remains in a powerful daily uptrend but looks stretched into nearby resistance. The base case stays bullish, with higher odds of pause-and-retest than a clean breakout. Therefore, expect strength with volatility, and respect short-term pivots for timing.
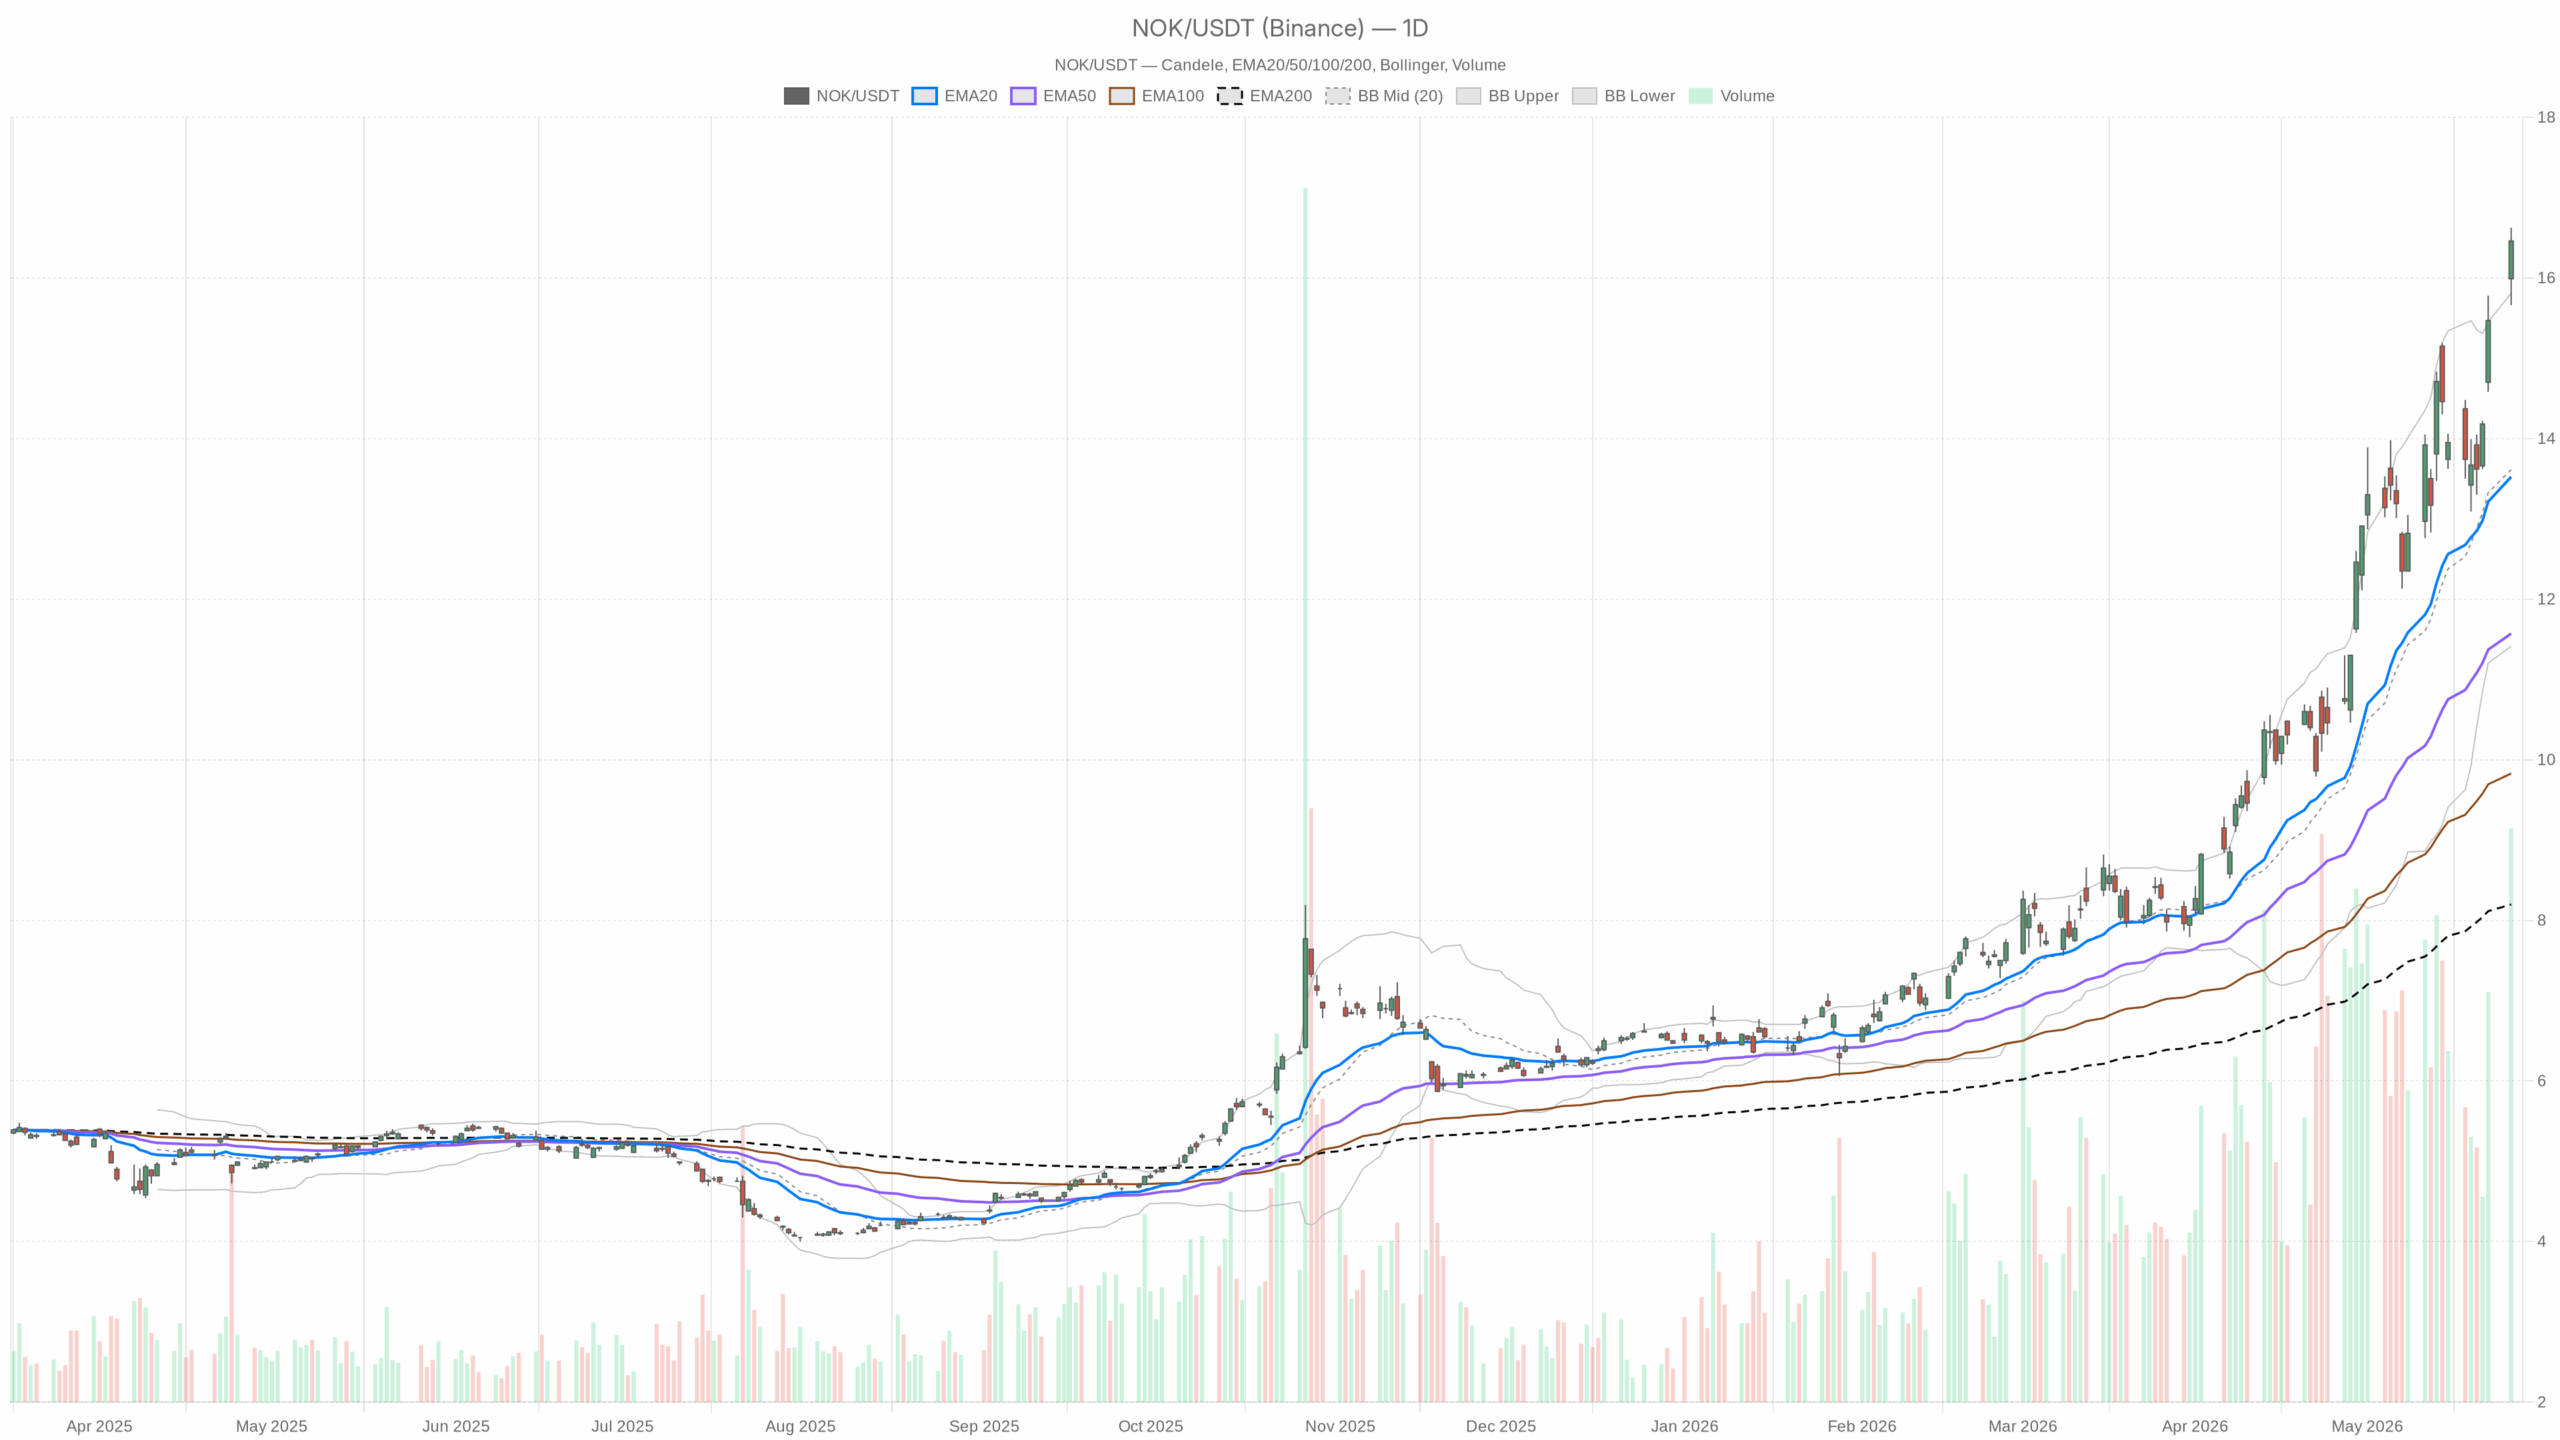 NOK — daily chart with candlesticks, EMA20/EMA50 and volume.
Nokia Stock Technical Overview: Uptrend Stretched Into Resistance
Daily Trend and Momentum
On the daily chart, NOK closed at 16.46 after a wide session, reinforcing the primary uptrend. The 20/50/200-day EMAs sit at 13.52/11.57/8.20, with price well above all three. Therefore, the long-term trend is firmly higher and pullbacks are likely to be bought.
The daily RSI(14) is 75.28. Momentum is hot and overbought, increasing the odds of consolidation or shallow dips. Meanwhile, the MACD line remains above its signal (1.21 vs 1.10) with a modest histogram of 0.11. Upside momentum persists, but acceleration is not increasing.
Volatility and Pivots
Daily Bollinger Bands show the mid at 13.61 and the upper band at 15.81, with price at 16.46. Price has pushed above the upper band, a sign of strong trend but near-term excess that often precedes digestion. The ATR(14) is 1.00, so daily swings near $1 are in play for risk sizing.
The daily pivot is 16.25 with R1 at 16.84 and S1 at 15.87. Notably, 16.25 is first reference support, while 16.84 is the next obvious upside hurdle.
Hourly Read: Uptrend Intact, Momentum Cooling
Support, Oscillators, and Pivot Map
Meanwhile, the 1-hour timeframe broadly confirms the daily bias but hints at cooling intraday momentum. Price closed 16.45 and sits near the hourly pivot at 16.44, signaling a test of balance after a run. The 20/50/200-hour EMAs at 15.55/14.72/12.83 slope higher beneath price, keeping trend support intact.
The hourly RSI(14) is 77.59, leaving conditions stretched and favoring pauses over chase entries. The MACD is above its signal (0.66 vs 0.57) with a small histogram of 0.08. Bullish bias remains, while incremental momentum wanes.
Hourly Bollinger Bands put the mid at 15.38 and the upper band at 17.22, with price inside the band at 16.45. The ATR(14) is 0.35, consistent with two-way trade near highs. The pivot map shows R1 at 16.50 and S1 at 16.39. Holding above 16.39 keeps the micro uptrend orderly. A firm break through 16.50 would re-energize upside attempts.
15-Minute Execution: Structure and Key Zone
At the execution level, the 15-minute chart shows strong structure but softening momentum. The 20/50/200-EMA stack at 16.32/15.86/14.65 remains positively aligned under price, so micro dips are likely to find buyers. The 15-minute RSI(14) is 65.72, constructive yet less stretched than earlier.
However, the 15-minute MACD line sits slightly below its signal (0.16 vs 0.21) and the histogram is -0.05. This favors a brief pullback or sideways reset. Bollinger mid is 16.40 with bands at 16.68/16.11 and price near the upper half at 16.45. The ATR(14) is 0.10, suiting precise entries near pivots.
The 15-minute pivot sits at 16.44 with R1 at 16.50 and S1 at 16.40. Therefore, 16.40–16.44 is the key intraday decision zone.
News and Sentiment: Re-Rating Supports Trend
Notably, the news tape aligns with the technical re-rating. Headlines highlight a 140% rally as investors reframe Nokia as AI infrastructure. Some analysts have flagged the name among top AI picks. In addition, Nokia’s UK appeal win on video coding patents removes a legal overhang. However, the same coverage also underscores a valuation puzzle after the surge, which can amplify pullbacks.
Scenarios: Bullish Path for Nokia Stock
Therefore, the bullish scenario remains the main case for Nokia Stock. A steady hold above the daily pivot at 16.25 and the hourly S1 at 16.39 would favor continuation attempts. Buyers remain in control as long as those levels act as a floor.
A push through the hourly R1 at 16.50 would set up a run at the daily R1 near 16.84. Reclaiming 16.50 would show momentum re-acceleration after digestion. Supportive EMA stacks across all timeframes and MACD lines above signals back this path. That argues for buying dips rather than chasing spikes.
Bearish Scenario and Risk Markers
In contrast, the bearish scenario would emerge if price loses 16.39 intraday, then the daily pivot at 16.25 on a closing basis. That sequence would mark a momentum fade and open a deeper mean-reversion. A slide toward the daily S1 at 15.87 and the daily upper Bollinger near 15.81 would be the first downside magnets.
Re-entering the daily band after an upside breach often signals consolidation. If the hourly MACD rolls under its signal, with RSI easing from the 70s, selling could persist. Expect it to occur within the daily ATR of about $1. Therefore, volatility would work against late longs until momentum resets.
Bottom Line: Strong Uptrend, Respect Resistance
Overall, Nokia Stock sits in a powerful uptrend with evidence of near-term exhaustion. Positioning around 16.40–16.50 is pivotal for the next leg. At the same time, wide daily ATR and overbought RSIs argue for disciplined entries and respect for stops. Until momentum recharges, favor controlled dips above 16.25 and avoid breakouts into 16.50–16.84.


You May Also Like

5 Features Every AI Trading Agent Will Expect From DeFi

Iran threatens retaliation as Trump vows to “hit hard,” crypto market under stress
Terra Luna Classic Bulls Refuse to Give Up: Another LUNC Rally Seems Close



