

RKLB stock holds a strong uptrend as RSI hits 71 and volatility jumps

RKLB stock remains in a powerful daily uptrend, yet momentum looks stretched and volatility is elevated. Therefore, the base case is bullish, with a tactical bias to respect nearby resistance and manage intraday whipsaws.
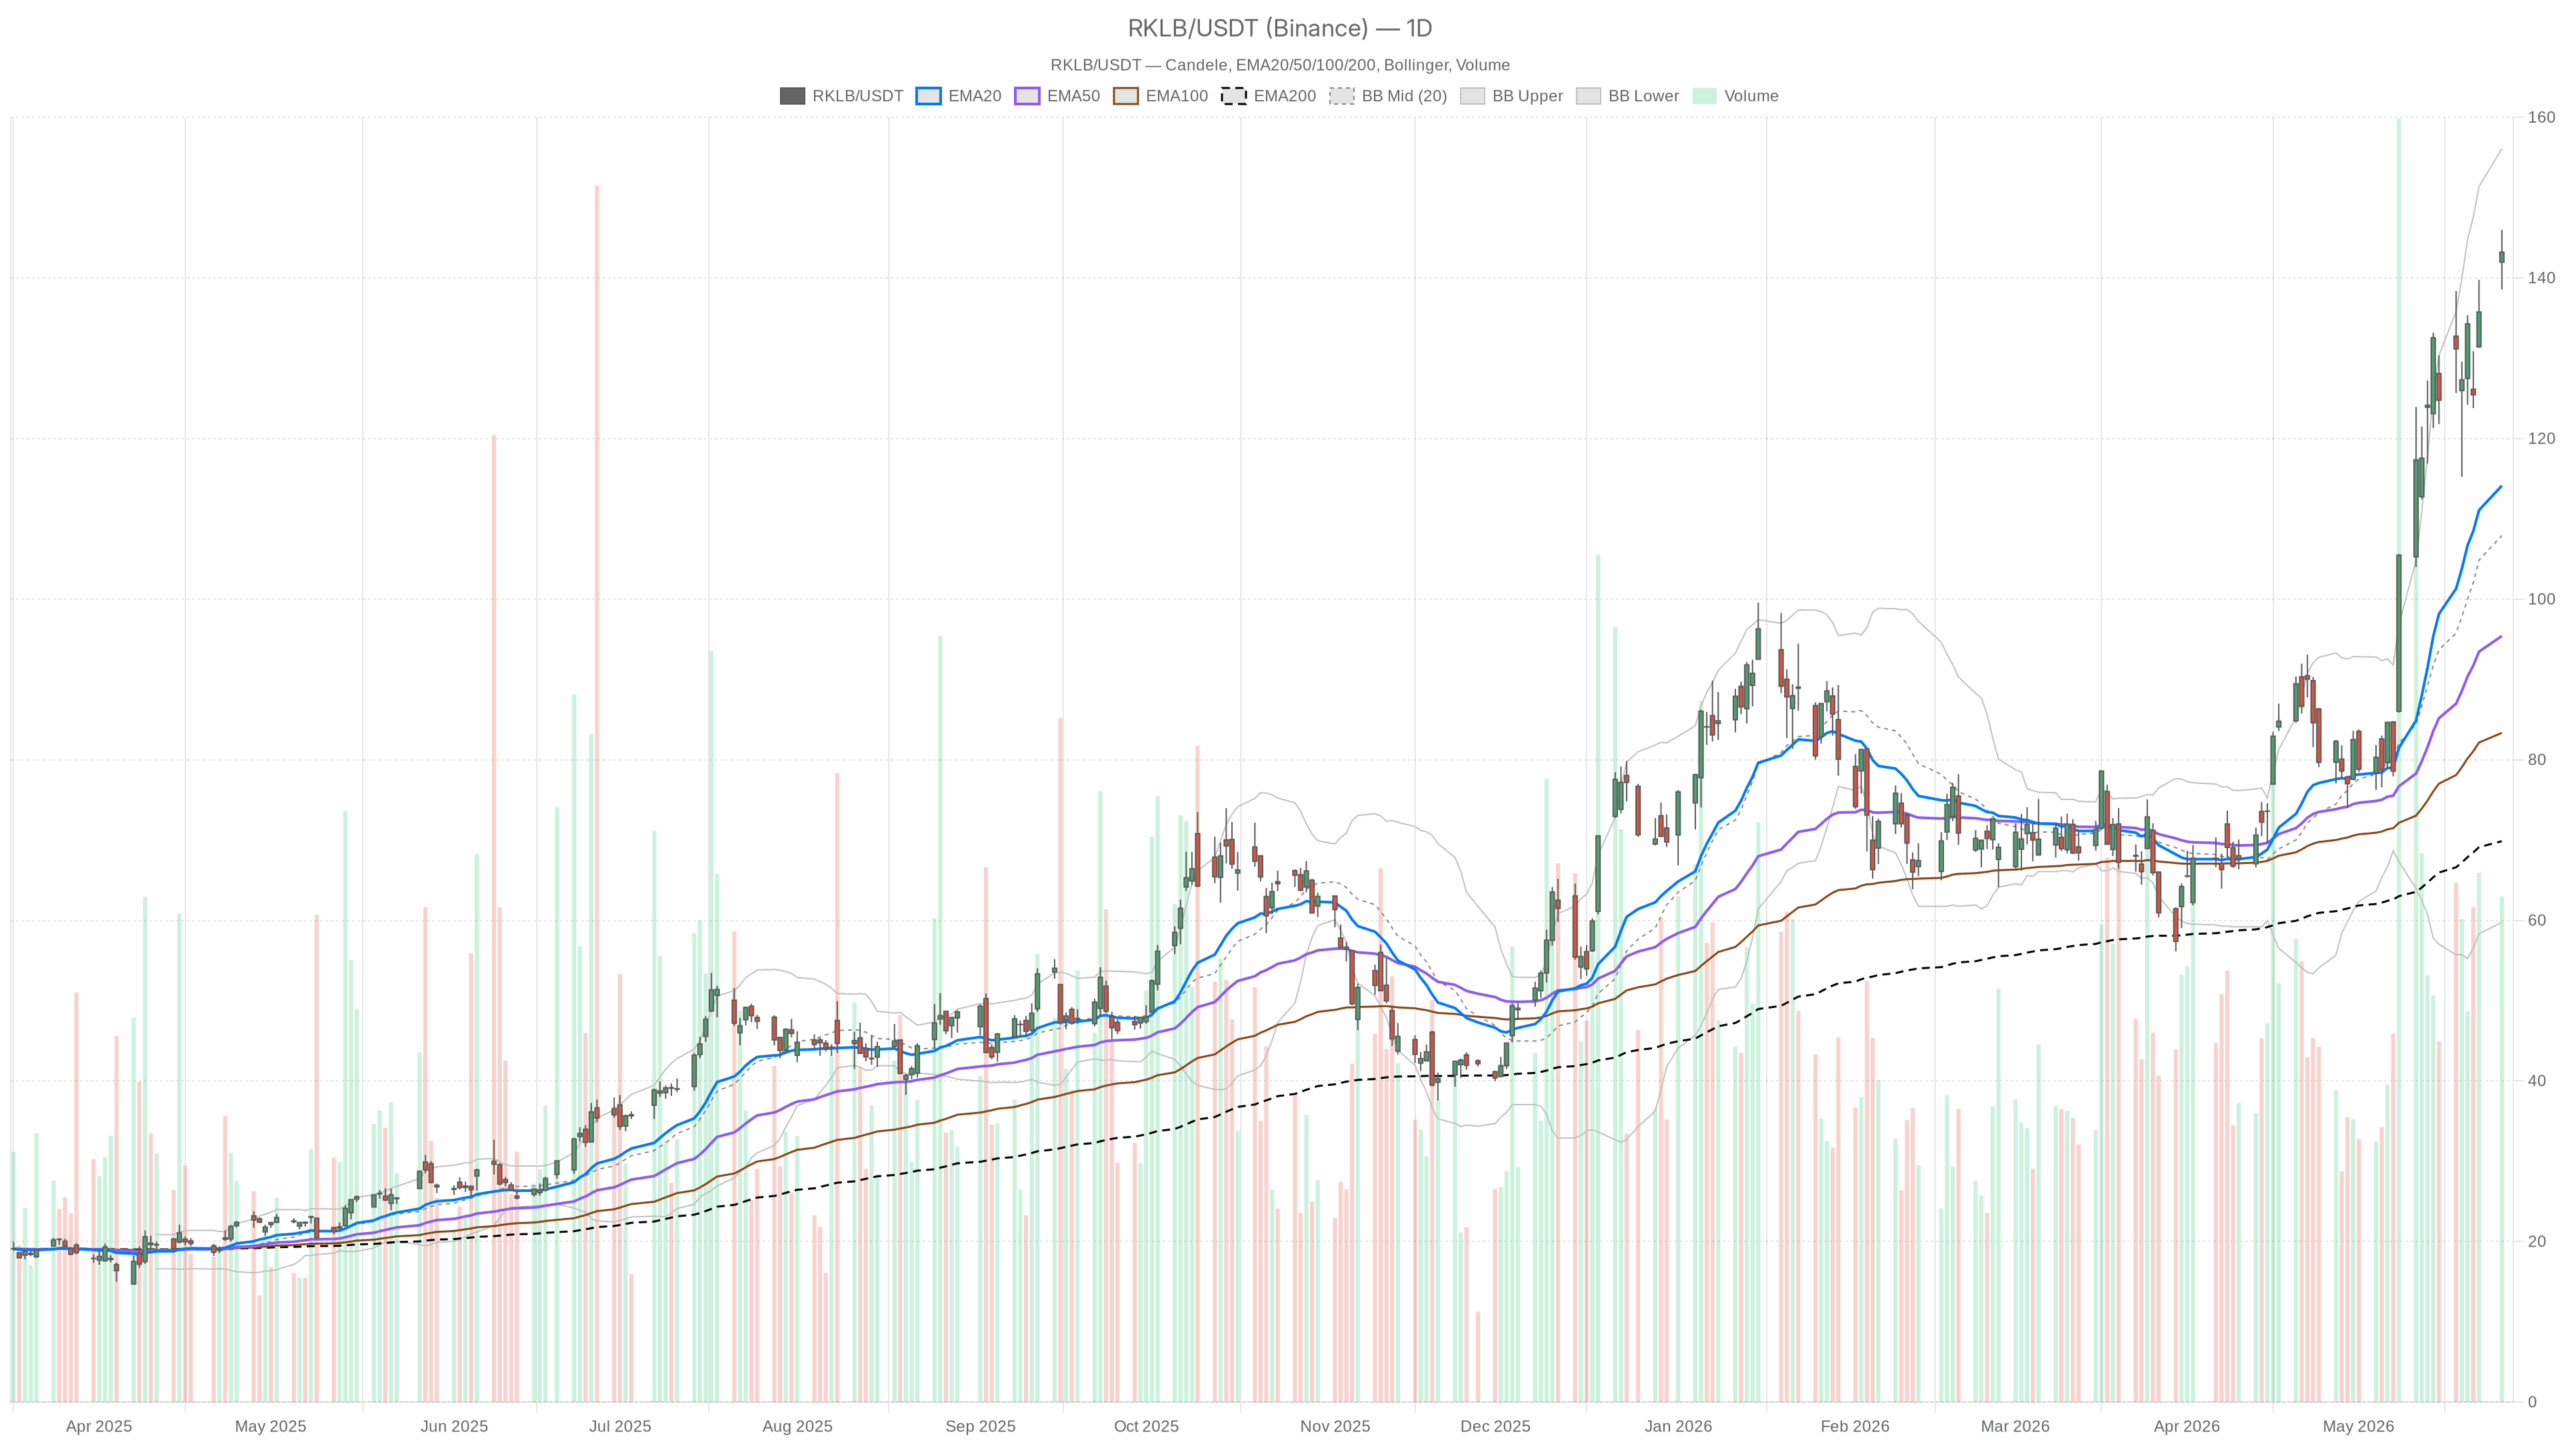 RKLB — daily chart with candlesticks, EMA20/EMA50 and volume.
Daily Trend and Momentum: RKLB stock Stretched Within a Strong Uptrend
On the daily timeframe, RKLB closed at 143.20 after ranging between 138.56 and 146.00. Buyers kept price pinned near the session’s upper end. The 20/50/200‑day EMAs sit at 114.13, 95.41, and 69.86, all rising and stacked. Trend strength remains firmly bullish and mature.
The daily RSI‑14 is 71.33, showing strong momentum entering overbought territory. Meanwhile, the MACD line at 15.48 is above the 13.01 signal, with a +2.47 histogram. Upside momentum still leads, though the push is no longer early.
D1 Volatility, Bollinger Bands, and Pivots
On D1, Bollinger Bands show a mid at 107.91 with an upper band at 156.08 and a lower at 59.74. Price sits in the upper half, leaving room toward the upper band within a wide envelope. Notably, ATR‑14 at 12.68 underscores high daily volatility and abrupt swings.
Daily pivots mark PP at 142.59, R1 at 146.61, and S1 at 139.17. Price settled just above PP and below R1, defining 142.6–146.6 as the immediate decision zone. Therefore, the regime flag stays bullish while resistance concentration remains close.
Hourly Chart: RKLB stock Momentum Supports Dips
On 1H, the 20/50/200‑hour EMAs are 137.81, 130.88, and 106.10. Intraday structure aligns bullish with higher lows. The 1H RSI is 63.93, which is positive without being stretched. Meanwhile, the MACD at 4.11 holds above the 3.50 signal, with a +0.61 histogram.
Hourly Bollinger Bands show a mid at 135.93 with an upper at 149.58 and a lower at 122.28. The 1H ATR is 4.44, so ranges are wide enough to challenge stops. Hourly pivots place PP at 142.80, R1 at 144.60, and S1 at 141.49. A break of 144.60 would confirm continuation pressure.
15-Minute Execution: Pause Near Pivot, Micro‑Trend Intact
On 15m, the 20/50/200 EMAs at 142.27, 139.40, and 130.57 still slope higher. Momentum has cooled to neutral‑positive, with RSI at 55.52. However, the MACD line at 0.92 sits below the 1.34 signal and prints a −0.42 histogram. A short pause or minor pullback is developing.
The 15m Bollinger mid is 143.13 with bands at 145.24 and 141.02. Meanwhile, PP/R1/S1 at 142.80/144.60/141.49 frame the tactical battleground. Execution focus stays on 142.8 support and 144.6 resistance.
Fundamental Context: Growth Supports Trend, Equity Program Adds Overhang
Notably, recent headlines help explain resilient dip demand in RKLB stock. Q1 revenue grew 63.5% to $200.3 million, and backlog doubled to $2.2 billion, reinforcing the growth story. At the same time, management’s plan for an equity program of up to $3 billion introduced an overhang. That headline briefly knocked RKLB last week. Potential supply from future share sales can cap rallies near resistance. Shares also pressed to 52‑week highs, signaling strong sponsorship despite episodic shocks.
Bullish Scenario: Above 144.60/146.61 Opens Extension Toward 156.08
A push through 144.60 on 1H and a daily close above 146.61 would clear immediate supply. Demand would be absorbing overhead offers. From there, the upper daily Bollinger near 156.08 becomes a valid extension marker. Confirmation would include the 1H MACD expanding and RSI holding north of 60.
Bearish Risks: Losing 142.80/141.49 Tilts Control; Watch 139.17 and 114.13
On the other hand, losing the pivot shelf would warn of momentum fatigue. A sustained slip below 142.80 and 141.49 would tilt intraday control to sellers. A daily close under 139.17 would invalidate the near‑term bullish case and put mean reversion in play toward the 20‑day EMA at 114.13. Meanwhile, an elevated D1 ATR of 12.68 amplifies gap and overshoot risk, so downside moves can be fast.
Bottom Line: Stretched Yet Orderly Uptrend in RKLB stock
Overall, RKLB stock trades in a stretched but orderly uptrend. The daily bias is bullish, the hourly trend confirms, and the 15‑minute shows a pause rather than a reversal. However, volatility is high and the prospective equity program adds a headline ceiling. Until key pivots break, expect choppy continuation around 142.8, 144.6, and 146.6.


You May Also Like

JIC Ventures backs Webout as it takes real-time video personalisation platform to the US

Exclusive interview with Smokey The Bera, co-founder of Berachain: How the innovative PoL public chain solves the liquidity problem and may be launched in a few months
Monster Beverage (MNST) Stock Hits 52-Week High After Strong Q1 Earnings



