

Biontech stock holds near $92 as the daily downtrend stays intact

Biontech stock (BNTX) stays in a daily downtrend even as intraday action firms near $92; the 1D close at 92.25 sits just above the 92.16 pivot, leaving the broader structure heavy while the 1H tone only partially offsets that pressure.
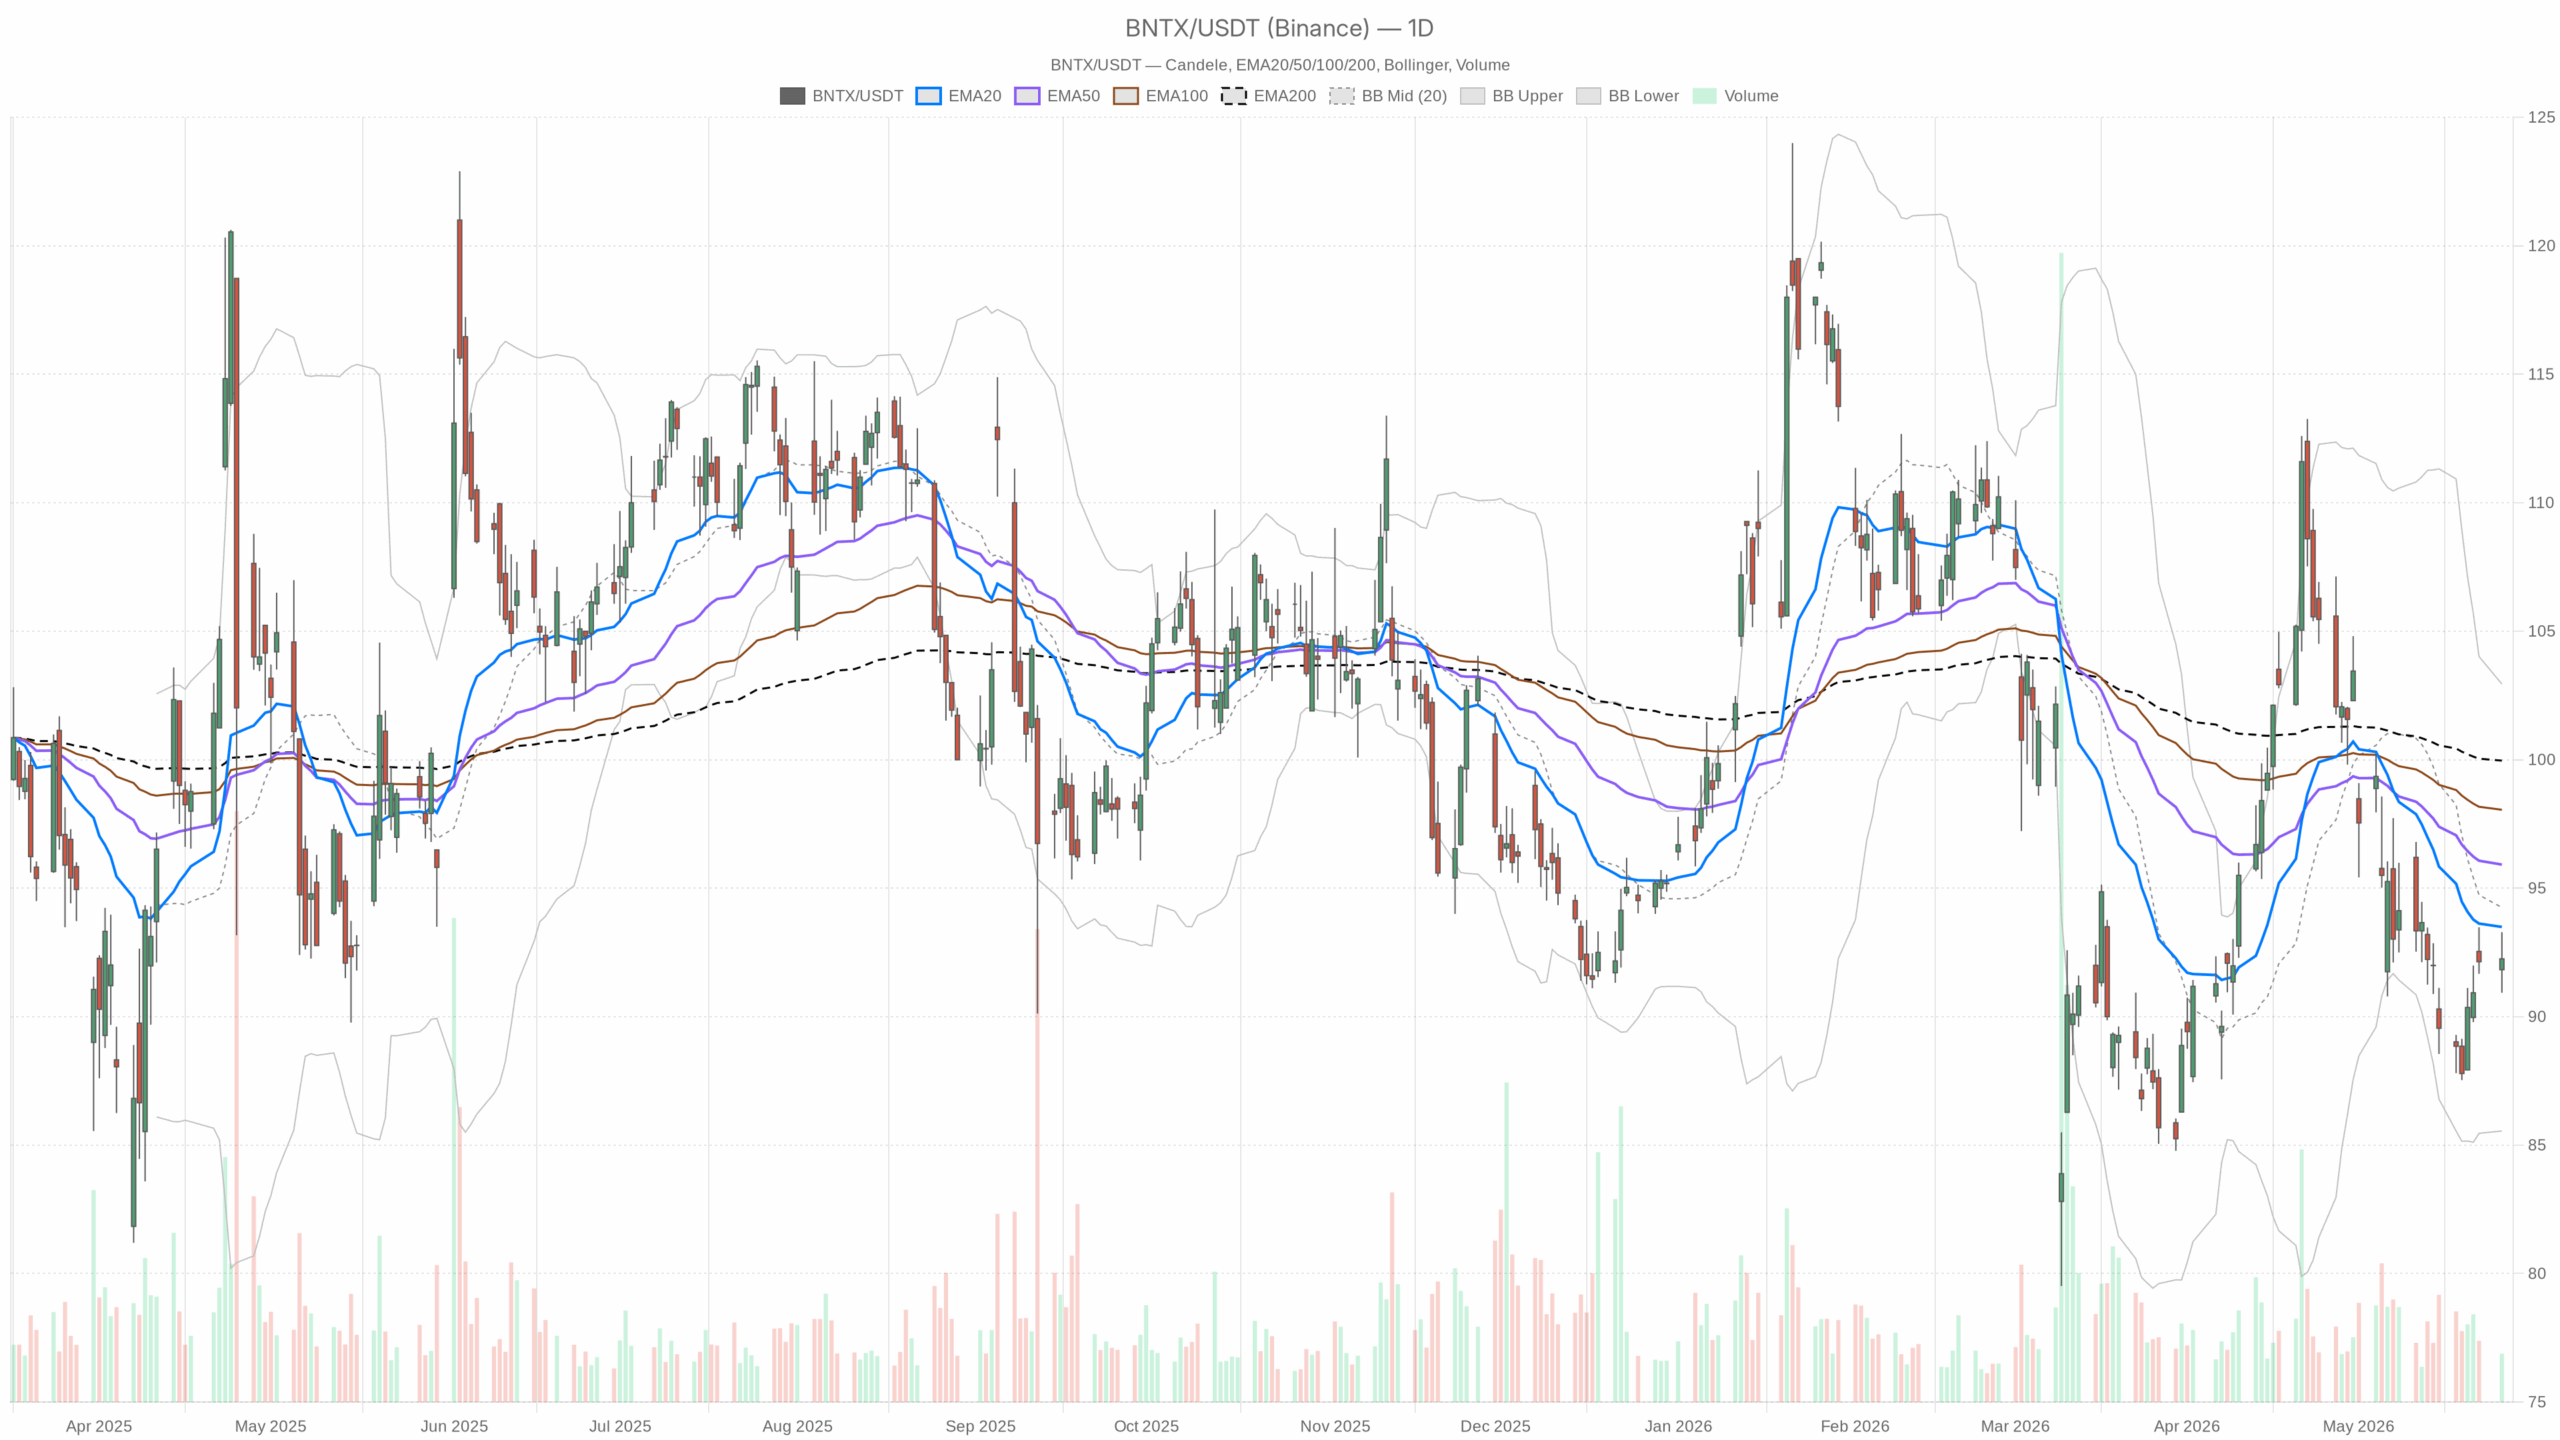 BNTX — daily chart with candlesticks, EMA20/EMA50 and volume.
Biontech stock daily outlook: trend remains lower
Trend and moving averages
On the daily timeframe, price is below the 20/50/200 EMAs at 93.49/95.92/99.96. The trend still points lower, with layered resistance overhead. The 1D close at 92.25 is marginally above the daily pivot at 92.16, but the structure remains heavy.
Momentum, bands, ATR, pivots, and volume
RSI14 prints 44.82, keeping momentum below neutral and leaving sellers a modest edge. The daily MACD reads line -2.03 vs signal -1.82, histogram -0.22, so bearish momentum persists but is not accelerating. Bollinger Bands center at 94.25 with upper/lower at 102.94/85.55; price trades in the lower half, allowing room for mean reversion within a bearish context.
ATR14 is 3.04, implying active daily ranges of roughly three dollars. Daily pivots are PP 92.16, R1 93.38, S1 91.02, and volume printed 527,346, showing no breakout day.
Intraday 1H tone: stabilization below 200 EMA
On 1H, the tape is steadier but not outright bullish. Price is above the 20/50 EMAs at 92.03/91.57 yet below the 200 EMA at 94.08. Near-term support is building, but the larger cap remains overhead. Meanwhile, RSI14 is 55.2, and intraday momentum leans positive.
MACD prints 0.62 vs 0.65 with histogram -0.02, signaling a stalling bounce. The Bollinger mid is 92.08 with bands at 93.67/90.5, keeping price near mid-band and the tone balanced. ATR14 is 0.84. Pivots show PP 92.47, R1 92.69, S1 92.07, with price fractionally below PP.
15-minute execution context: afternoon softening
Into the New York afternoon, the 15m profile has softened. Price is under the 20/50 EMAs at 92.69/92.36 but above the 200 EMA at 91.51, a pullback within a tentative intraday upturn. RSI14 sits at 41.55 as short-term momentum fades. MACD is 0.08 vs 0.14 with histogram -0.07, showing micro momentum flipping back to sellers.
The Bollinger mid is 92.73 with bands at 93.37/92.1, keeping price in the lower half and pressuring support. ATR14 is 0.27. Pivots read PP 92.46, R1 92.67, S1 92.08; price sits below PP.
Cross-timeframe read: countertrend bounce within downtrend
Timeframes conflict modestly. The 1D remains bearish, the 1H is neutral to constructive, and the 15m is wobbling lower. Therefore, the net read is a weak countertrend bounce inside a broader downtrend for BNTX.
Scenarios for Biontech stock
Bullish setup
A push back above the 1H PP at 92.47 and R1 at 92.69 would firm the intraday bid. A daily close through 93.38 (daily R1) and the 1D EMA20 at 93.49 would start to chip away at the bearish regime. A MACD uptick on 1D would confirm improving momentum. Notably, the daily Bollinger mid at 94.25 is the next mean-reversion waypoint, with the EMA50 at 95.92 further overhead. With ATR14 at 3.04, a 1–2 point follow-through is feasible within a typical session.
Bearish continuation
The bearish continuation case regains control if price fails beneath 92.47/92.69 and slips under the daily PP at 92.16. A fade back below the 1H RSI 50 would weaken the intraday floor. A break of the clustered S1 levels near 92.07–92.08 and then the daily S1 at 91.02 would realign the tape with the dominant downtrend. In contrast, the daily lower Bollinger at 85.55 marks the tail-risk zone if selling broadens and volatility expands.
Consequently, positioning around Biontech stock should respect the prevailing daily downtrend while acknowledging intraday stabilization attempts near $92. Volatility is active yet contained by the pivots and ATR profile, so level-by-level reactions matter. Until the 1D reclaims its short-term averages, BNTX favors rallies being sold rather than chased.


You May Also Like

Why Most Companies Are Leaving AI (And What It’s Doing to AI Culture)

Bernstein Lifts UnitedHealth (UNH) Stock Price Target to $492 Amid Medicare Advantage Turnaround

Republicans privately getting ready to start a new battle at Trump’s demand



