

Bitcoin’s 4-Year Rhythm Is Still Playing Out, Says Crypto CEO
A countertrend rally that pushed Bitcoin to $82,800 has done little to change one analyst’s bearish outlook — because he says the bounce itself is proof the pattern is repeating.
What The Charts Are Showing
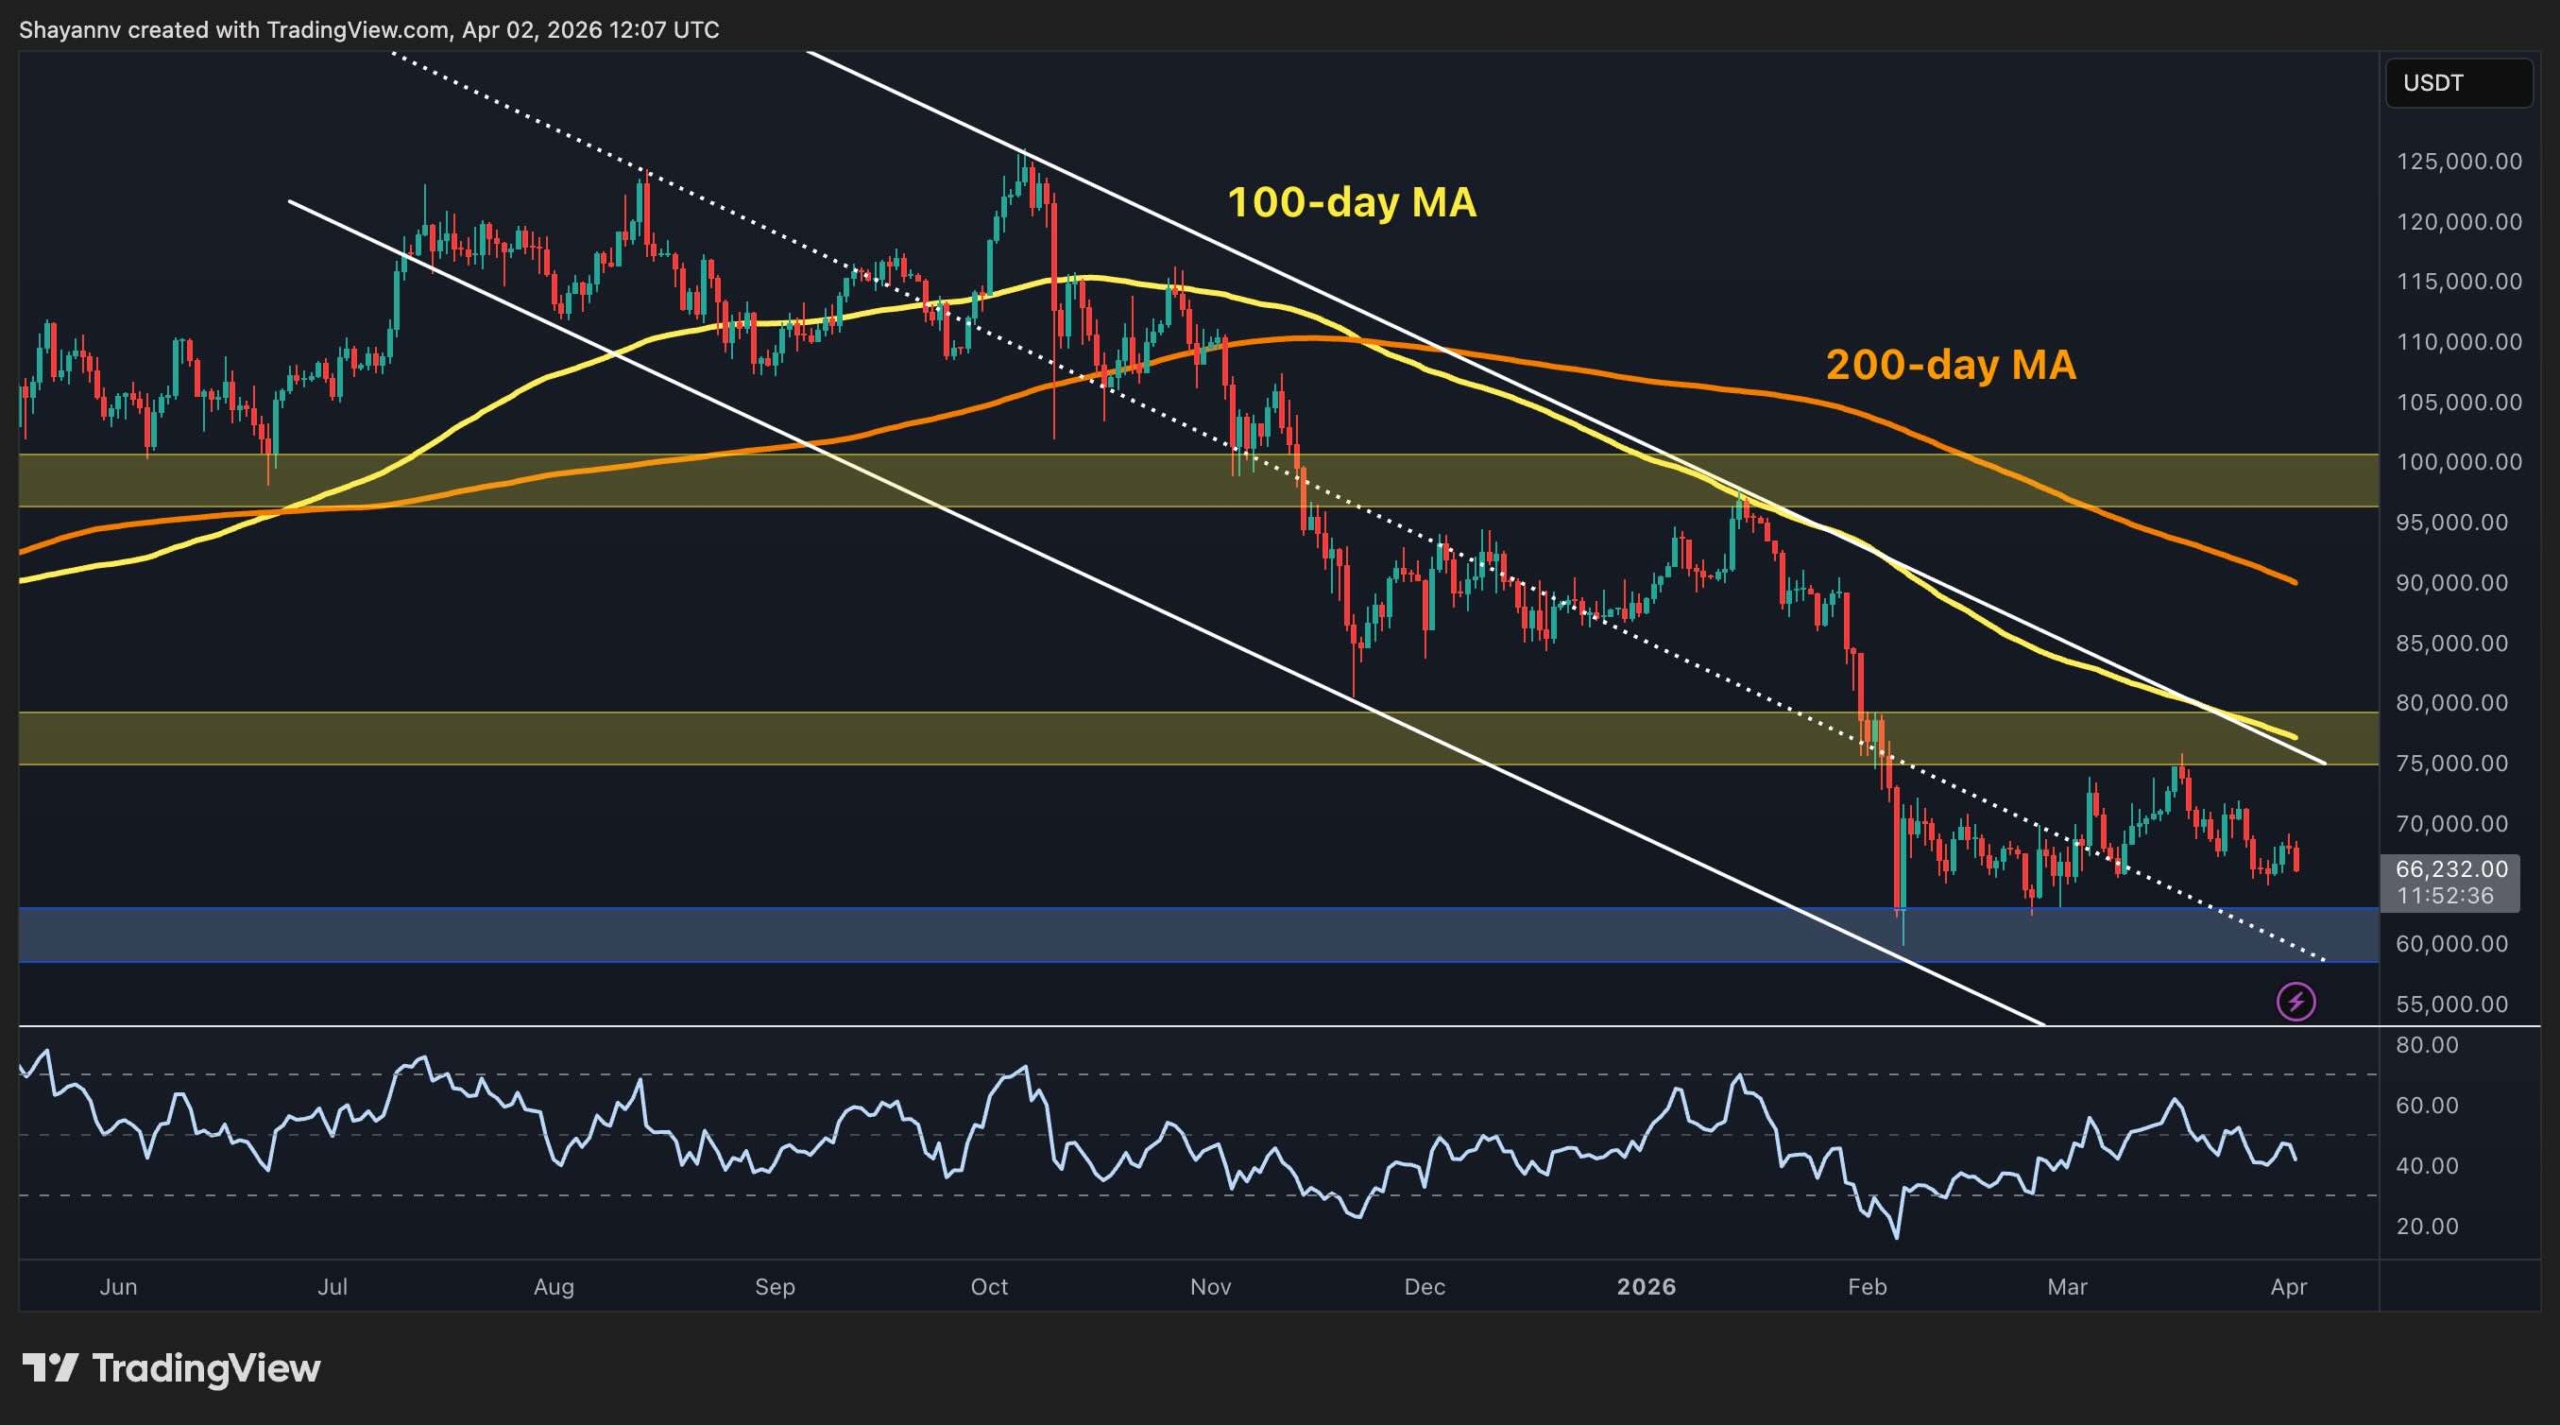
Benjamin Cowen, founder and CEO of Into The Cryptoverse, points to a recurring rejection at the 200-day simple moving average as a key signal. The same thing happened in 2018 and 2022, and both times it came just before the final leg down.
Cowen also noted that some countertrend rallies in past cycles ran longer than 20 weeks. The current one clocked in at 16 weeks, which he says undercuts the argument that Bitcoin has already found its floor.
Bitcoin Peaked On Schedule
According to Cowen, Bitcoin’s run-up to $126,200 in October 2025 landed within the expected cycle window when measured from the previous low to the high. That kind of timing at the top, he argues, makes it harder to dismiss the same framework when looking at where the bottom might land.
Past cycles put their lows in the closing months of the midterm year — December 2018 and November 2022, specifically. Based on that pattern, Cowen believes the bottom is still ahead, likely toward the end of 2026.
Two charts he shared support the view. One tracks the return on investment from the market cycle peak to the bear market low. The other tracks the multiplier from bear market lows to the next bull market peak. Both are following the shape of prior cycles, even if the raw numbers are smaller this time around.
When The Drop Could Come
Cowen had previously flagged May and June as the window when the next significant decline would begin. He expects that move to carry Bitcoin below the February 6 low of $60,000 — a level that a number of other analysts have called the cycle bottom.
Not everyone sees another drop coming. Analyst Sykodelic has predicted Bitcoin will climb past $90,000 in June after retesting a key level of support.
The debate reflects a broader split in how analysts are reading the market right now. Cowen’s position rests on the idea that the four-year cycle, tied to Bitcoin’s halving schedule, continues to drive price behavior in a predictable way despite the asset’s growth and changing market structure.
Featured image from Pexels, chart from TradingView


You May Also Like

BIS and Global Banks Launch Live Blockchain Payment Tests Under Project Agorá
Bitcoin Price Analysis: What’s Next for BTC After Tanking to $66K?

Cardano price today pinned at $0.23 — reclaim $0.24 or risk slide



