

Top 3 Price Prediction: Bitcoin, Ethereum, Ripple – BTC, ETH, and XRP recover as the key support level holds
- Bitcoin price hovers around $111,900 on Monday, after falling 2.66% the previous week.
- Ethereum recovers trading around $4,120 after finding support around the 100-day EMA.
- XRP holds support at $2.72, with bulls eyeing a potential recovery from recent declines.
Bitcoin (BTC), Ethereum (ETH) and Ripple are showing signs of stabilization at the start of the week, each holding above key support levels after recent declines. While BTC struggles to regain momentum near $112,000, ETH and XRP are finding their footing, which could pave the way for short-term recoveries.
Bitcoin shows some signs of recovery
Bitcoin price failed to find support around $116,000 on September 19 and declined by 6%, reaching a low of $108,631 on Thursday. However, BTC recovered slightly in the next three days. At the time of writing on Monday, it trades at around $111,700.
If BTC continues its recovery and closes above the 50-day Exponential Moving Average (EMA) at 113,232 on a daily basis, it could extend the recovery toward the daily resistance at $116,000.
The Relative Strength Index (RSI) on the daily chart reads 45, pointing upwards and nearing its neutral level of 50, which indicates a fading bearish momentum. For the recovery rally to be sustained, the RSI must move above the neutral level.
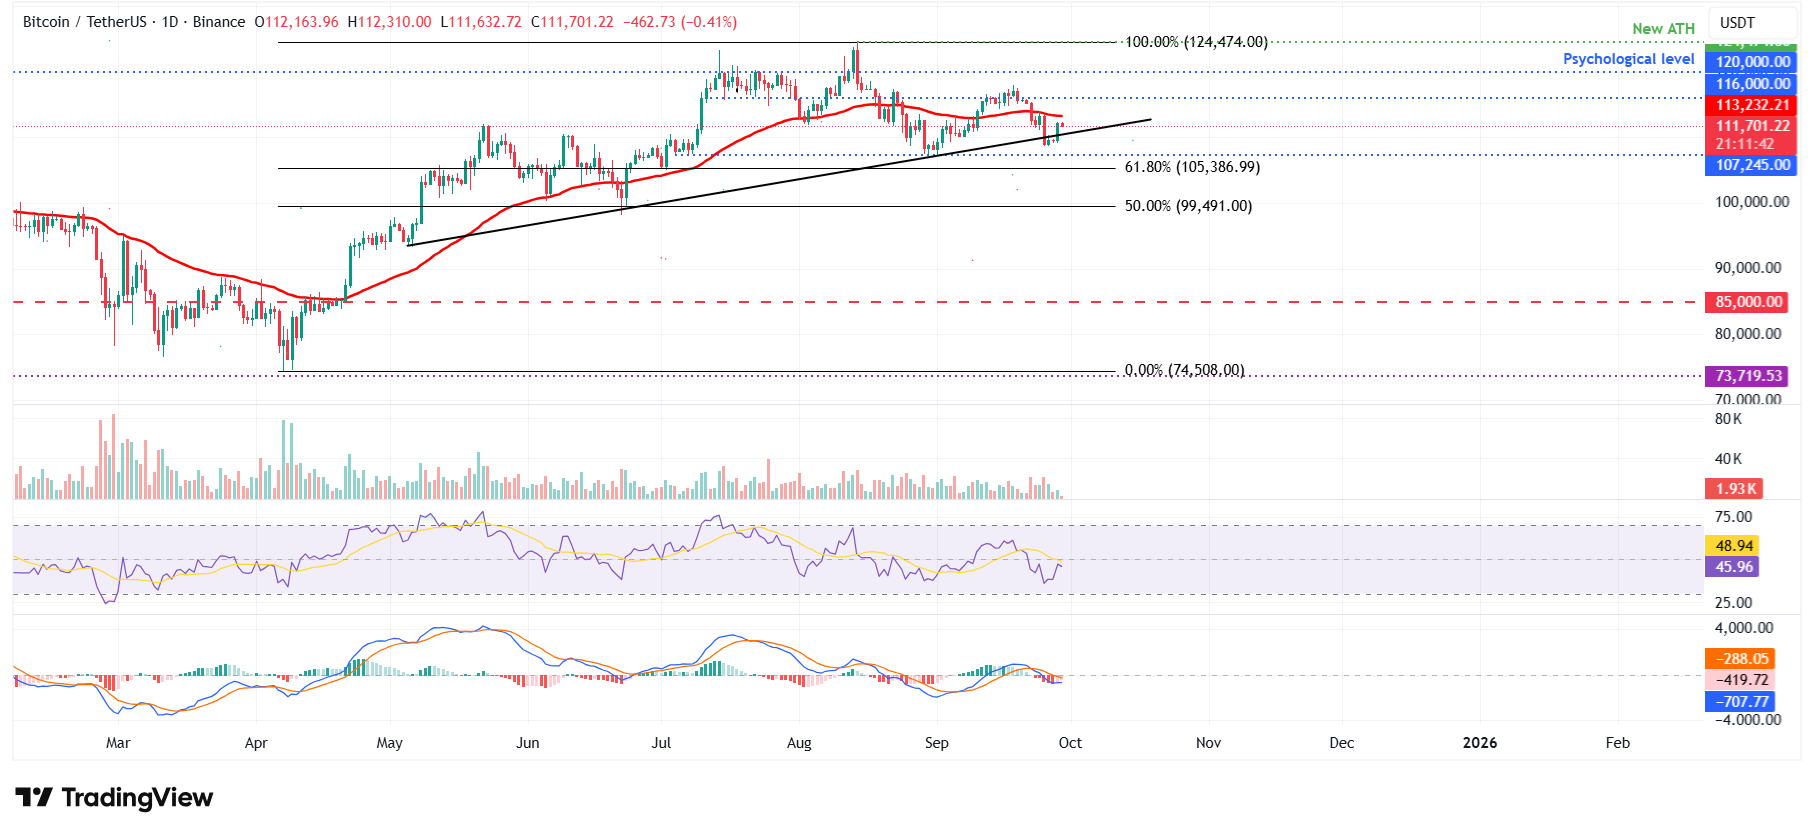
BTC/USDT daily chart
However, if BTC fails to close above the 50-day EMA and faces a correction, it could extend the decline toward the daily support at $107,245.
Ethereum could extend its recovery if it closes above $4,232 mark
Ethereum price failed to find support around the daily level at $4,232 last week and declined 7.36% until Thursday. However, on Friday, ETH retested and found support around the 100-day EMA at $3,863, and by Sunday, it had recovered 7.10%. At the time of writing on Monday, it trades at around $4,100.
If ETH continues its recovery and closes above $4,232, it could extend the rally toward the next daily resistance at $4,488.
Like Bitcoin, Ethereum’s RSI reads 42 and, pointing upwards and nearing its neutral level of 50, indicates fading bearish momentum. For the recovery rally to be sustained, the RSI must move above the neutral level.
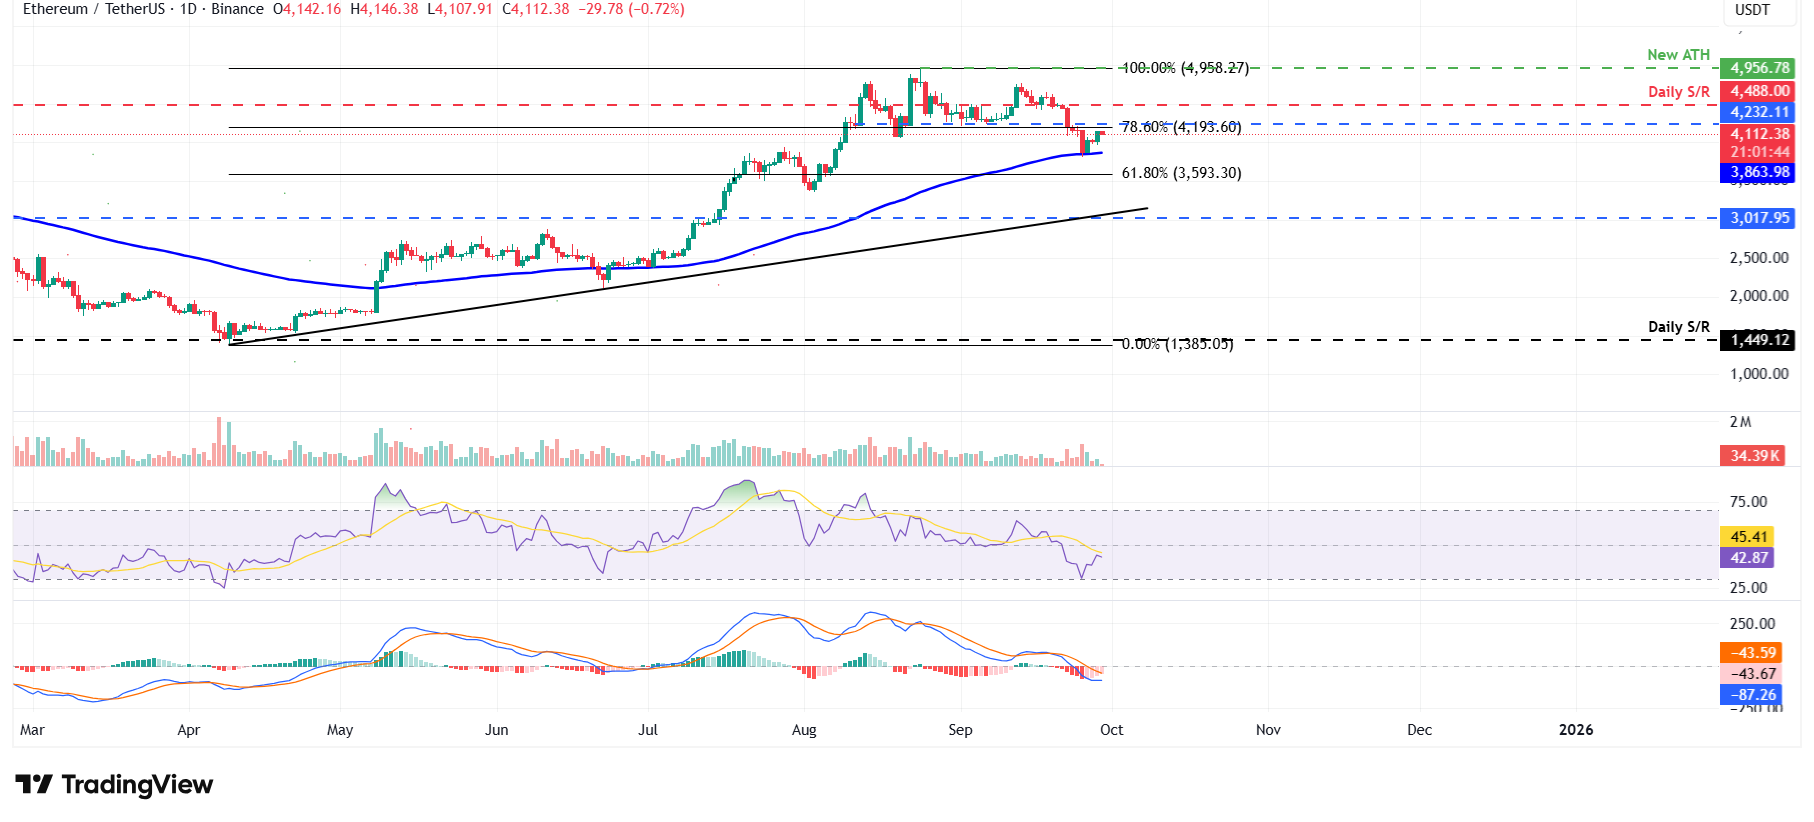
ETH/USDT daily chart
On the other hand, if ETH faces a correction, it could extend the decline toward the 100-day EMA at $3,863.
XRP shows signs of fading bearish momentum
Ripple’s XRP price corrected after retesting its daily level at $2.93 on Thursday and declined 6.23%. XRP retested the daily support at $2.72 the next day and recovered 4.52% by Sunday. At the time of writing on Monday, it trades at around $2.86.
If XRP closes above the $2.93 resistance level, it could extend the rally toward the key psychological level at $3.
Like BTC and ETH, XRP RSI also shows fading bearish momentum. However, for the recovery rally to be sustained, the RSI must move above the neutral level.
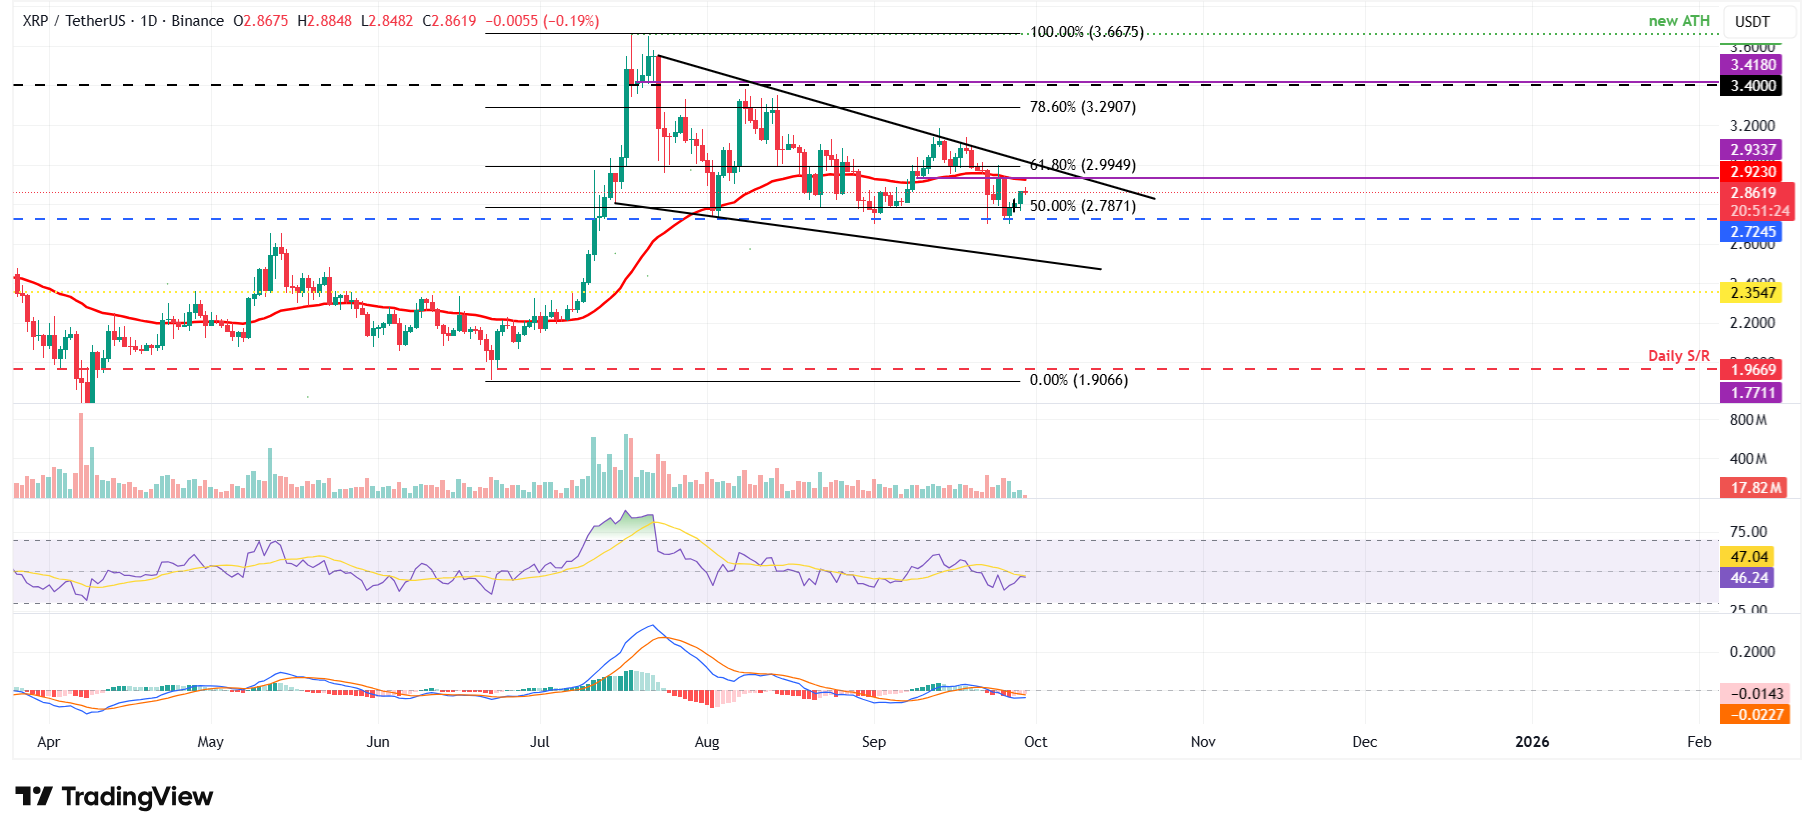
XRP/USDT daily chart
However, if XRP faces a correction, it could extend the decline toward the daily support at $2.72.
Bitcoin, altcoins, stablecoins FAQs
Bitcoin is the largest cryptocurrency by market capitalization, a virtual currency designed to serve as money. This form of payment cannot be controlled by any one person, group, or entity, which eliminates the need for third-party participation during financial transactions.
Altcoins are any cryptocurrency apart from Bitcoin, but some also regard Ethereum as a non-altcoin because it is from these two cryptocurrencies that forking happens. If this is true, then Litecoin is the first altcoin, forked from the Bitcoin protocol and, therefore, an “improved” version of it.
Stablecoins are cryptocurrencies designed to have a stable price, with their value backed by a reserve of the asset it represents. To achieve this, the value of any one stablecoin is pegged to a commodity or financial instrument, such as the US Dollar (USD), with its supply regulated by an algorithm or demand. The main goal of stablecoins is to provide an on/off-ramp for investors willing to trade and invest in cryptocurrencies. Stablecoins also allow investors to store value since cryptocurrencies, in general, are subject to volatility.
Bitcoin dominance is the ratio of Bitcoin's market capitalization to the total market capitalization of all cryptocurrencies combined. It provides a clear picture of Bitcoin’s interest among investors. A high BTC dominance typically happens before and during a bull run, in which investors resort to investing in relatively stable and high market capitalization cryptocurrency like Bitcoin. A drop in BTC dominance usually means that investors are moving their capital and/or profits to altcoins in a quest for higher returns, which usually triggers an explosion of altcoin rallies.


You May Also Like

Iran threatens retaliation as Trump vows to “hit hard,” crypto market under stress
XRP Price Prediction: Why a Surprise Rebound Could Be Near

How AI SaaS Companies and Automation Startups Are Getting Media Coverage Through Kooc Media


