

XRP Price Eyes $1.12 Breakout as ETF Inflows Climb to $1.44 Bn
Key Insights:
- XRP price held the $1.10 zone after a volatile session.
- XRP ETF inflows reached $1.44Bn across seven U.S. funds.
- Traders are now watching the $1.12 resistance and the $1.05 support.
XRP price traded near $1.11 on June 11 after a volatile session left buyers defending support. The token gained about 1% during the day, recovering from intraday weakness near $1.11. Heavy late volume pushed XRP through the same resistance area and briefly above $1.12.
CoinGlass data showed XRP ETF inflows reaching $1.44Bn across seven U.S. spot products. The latest session added $6.75M in fresh allocations. Still, the Ripple coin remains below key moving averages, leaving traders split between fund demand and a weak chart.
XRP Price Holds $1.10 as ETF Demand Supports Buyers
The $1.10 area remains the level traders are watching first. XRP price bounced from that zone after sellers failed to extend the latest decline. That rebound helped avoid a deeper test of the $1.05 floor.
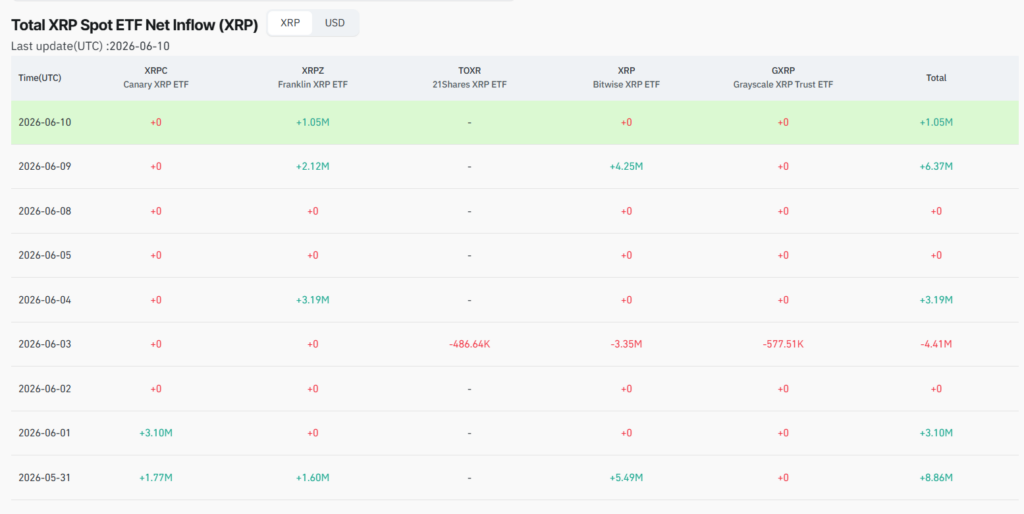 XRP ETF inflows | Source :
However, the recovery still lacks broad confirmation. The price of XRP remains below its 50, 100, and 200-day moving averages. The levels are now used for overhead resistance every time you bounce.
That setup explains why the market is cautious. ETF inflows show demand, but the chart still favors sellers. A clean daily close above $1.12 would improve the near-term tone.
XRP ETF Inflows Signal Demand But Not Full Control
The Cumulative inflows have climbed to $1.44Bn across seven live U.S. spot products. Total holdings now exceed 900 million XRP, based on flow data.
That level of accumulation tightens available market supply. It also shows that institutional desks continue to use regulated products for exposure. The latest $6.75M inflow keeps that trend alive, even as price action stays uneven.
Still, ETF demand has not delivered a clean breakout. XRP lagged behind crypto mainstays by almost two percent. This suggests that the selling pressure may be occurring elsewhere in the market, where fresh capital is being used.
XRP Price Prediction Turns on $1.05 and $1.13
The immediate range is now clear. Support sits between $1.05 and $1.10, while resistance starts near $1.12 to $1.13. A stronger recovery needs the XRP price to clear $1.1352 with volume.
Momentum indicators remain soft. The RSI near 44 sits below the 50 recovery zone. That reading shows buyers have not yet taken control of the short-term trend.
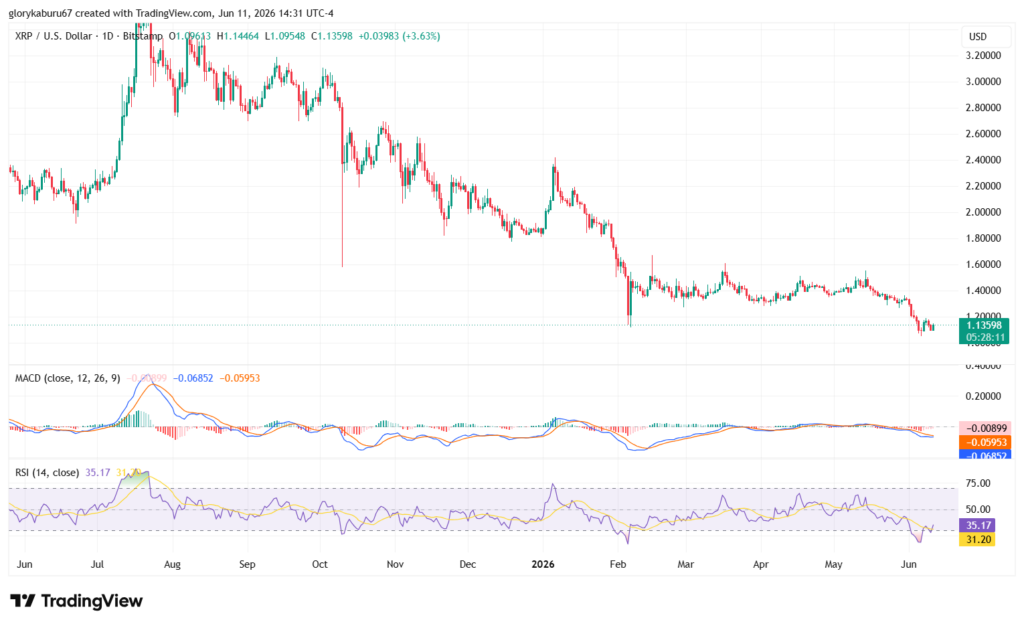 XRP/USD 1-Day price chart | Source: TradingView
A daily close below $1.05 would weaken the market structure. It could expose the $1.00 psychological level if volume rises. That would challenge the view that demand for XRP ETFs can protect against downside risk.
The bull case requires reclaiming the 50-day moving average. A move above $1.26 would begin to repair the broader chart. After that, traders could watch the $1.30 to $1.40 zone
Analysts Watch Wedge and TD Sequential Signal
Analysts are also tracking a wider falling wedge structure. The pattern formed after XRP declined from its July 2025 peak of $3.60. Its upper boundary now sits near $1.66.
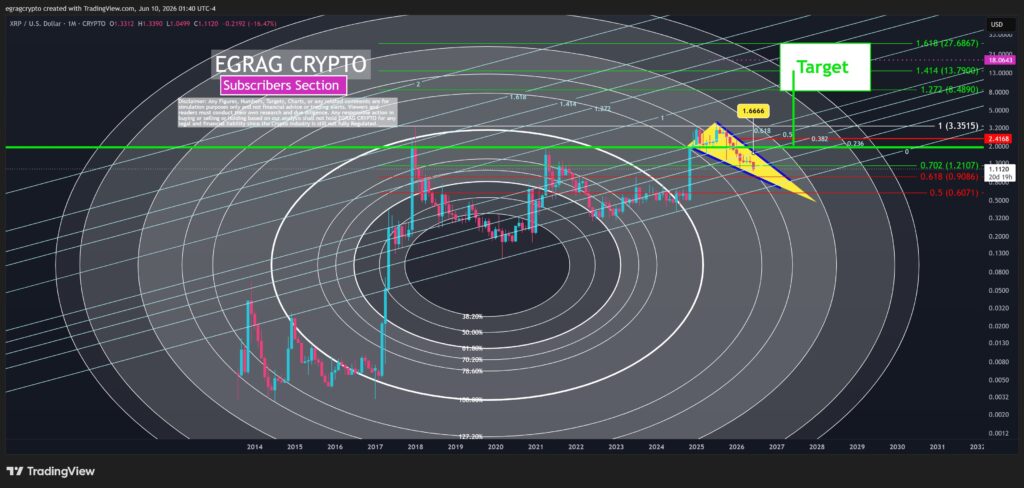 XRP price falling wedge structure | Source: EGRAG Crypto on X
A move toward that trendline would need almost 49% upside from current levels. EGRAG Crypto has linked a confirmed breakout to Fibonacci targets ranging from $8.48 to $27.68. Those levels require XRP to clear the wedge and recover above $
Ali Martinez also flagged a Tom DeMark Sequential buy signal on XRP’s three-day chart. The signal appeared after recent weakness pushed XRP toward yearly lows. Ethereum has also outperformed XRP over shorter cycles, keeping the XRP-to-ETH pair under pressure.
The post XRP Price Eyes $1.12 Breakout as ETF Inflows Climb to $1.44 Bn appeared first on The Coin Republic.


You May Also Like

Binance Red Packet Code 13 June 2026: Claim Free BNB Now

Federal Appeals Court Upholds Sam Bankman-Fried’s 25-Year Prison Sentence for FTX Collapse

Fed Governor Calls For Strong Stablecoin Oversight As CLARITY Act’s Final Text Gets Delayed


