

Jupiter price jumps 40% as bulls challenge key resistance near $0.20
Jupiter price has rebounded sharply from a multi-month low near $0.145 and is now testing the $0.20 resistance area as momentum indicators turn bullish.
- Jupiter price has rallied nearly 40% from its June low, returning to a critical resistance zone around $0.20.
- Improved market sentiment and rising trading activity have helped fuel the token’s rebound over the past week.
- Technical indicators have turned bullish, with traders watching for a breakout toward higher resistance levels.
According to data from crypto.news, Jupiter’s native token JUP climbed from a low of around $0.145 on June 11 to an intraday high near $0.20 on June 16.
The rebound came as traders returned to risk assets following reports that the United States and Iran had advanced toward a ceasefire framework that could reopen the Strait of Hormuz and ease concerns over energy supply disruptions.
The improvement in market sentiment triggered gains across cryptocurrencies, particularly among high-beta altcoins that had been under pressure for much of the year. As one of Solana’s largest decentralized finance platforms, Jupiter benefited from renewed activity across the network as capital flowed back into decentralized trading applications.
At the same time, trading activity on Jupiter accelerated. Daily volume increased sharply during the rally, with reported 24-hour turnover surpassing $46 million. Rising spot demand coincided with liquidations of bearish positions on derivatives exchanges, creating additional buying pressure as traders were forced to close short positions.
Jupiter price gains momentum after reclaiming key support
Jupiter’s recent price action suggests the recovery began before the geopolitical catalyst emerged. On the daily chart, JUP established a local bottom near $0.145, a level that had previously acted as a major support area.
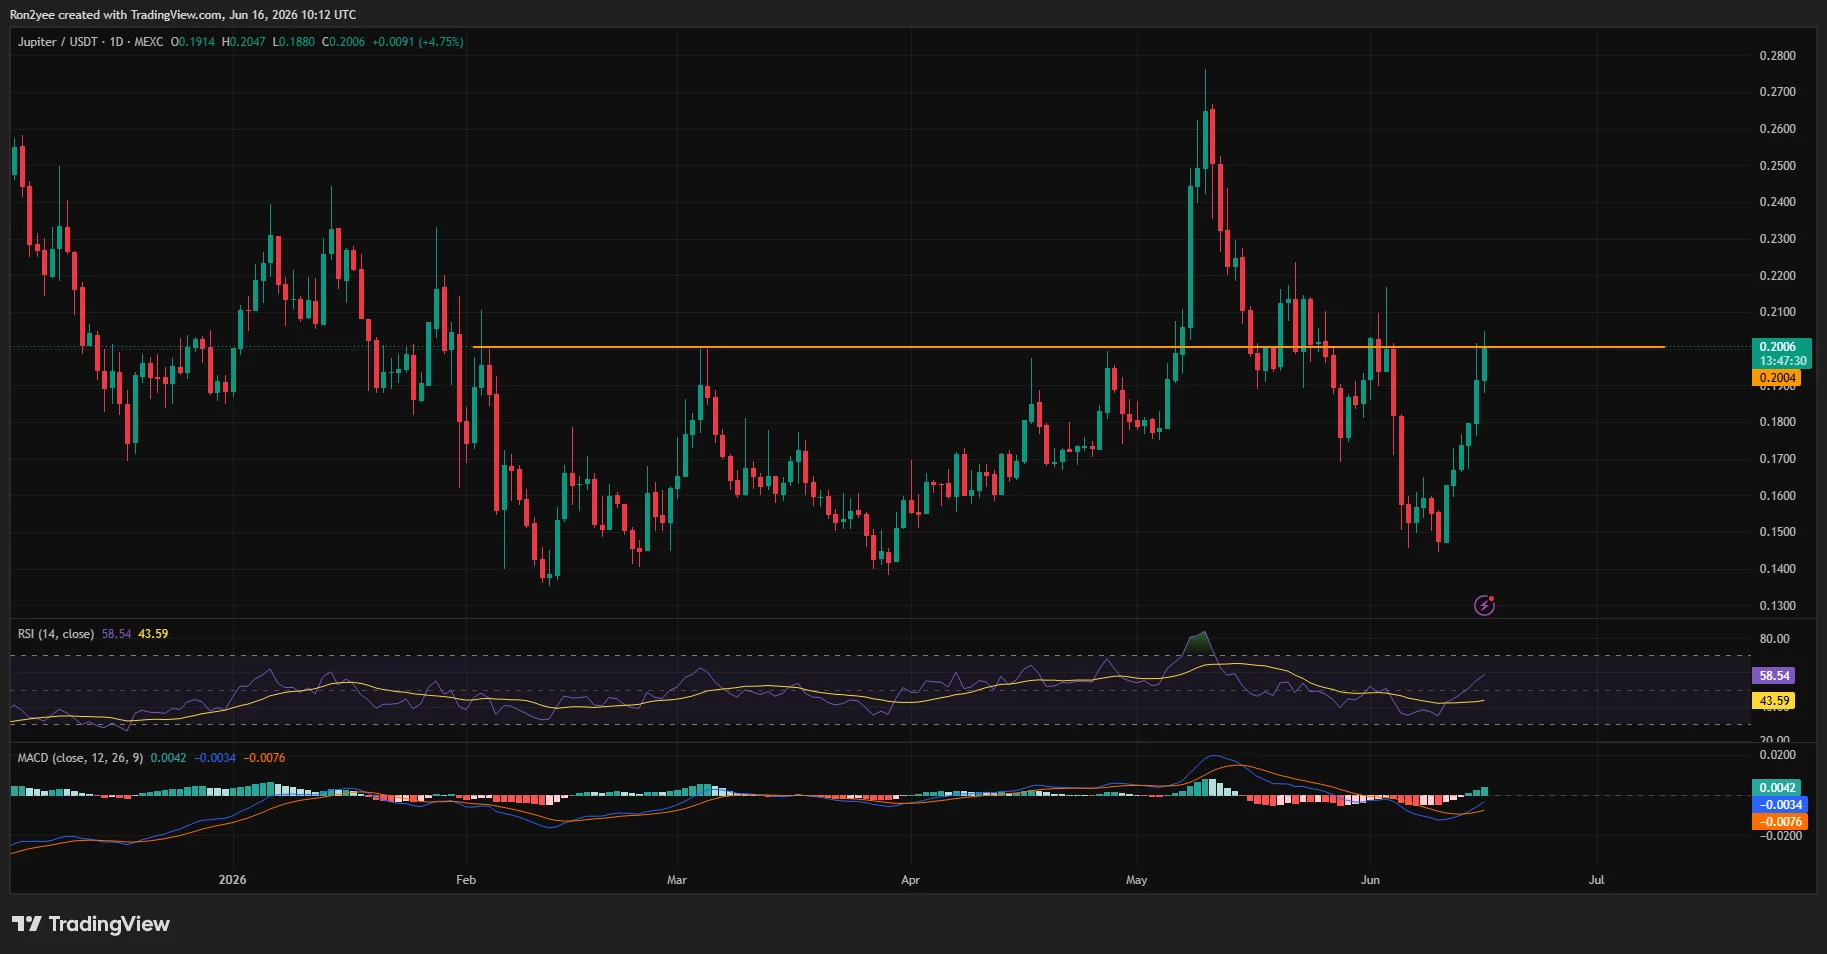
Technical indicators have since improved. The daily Relative Strength Index climbed above 58 after spending weeks below neutral territory, while the MACD indicator produced a bullish crossover and moved back into positive momentum. On the four-hour chart, JUP also reclaimed its Supertrend indicator, which shifted into bullish territory as the rally gained pace.
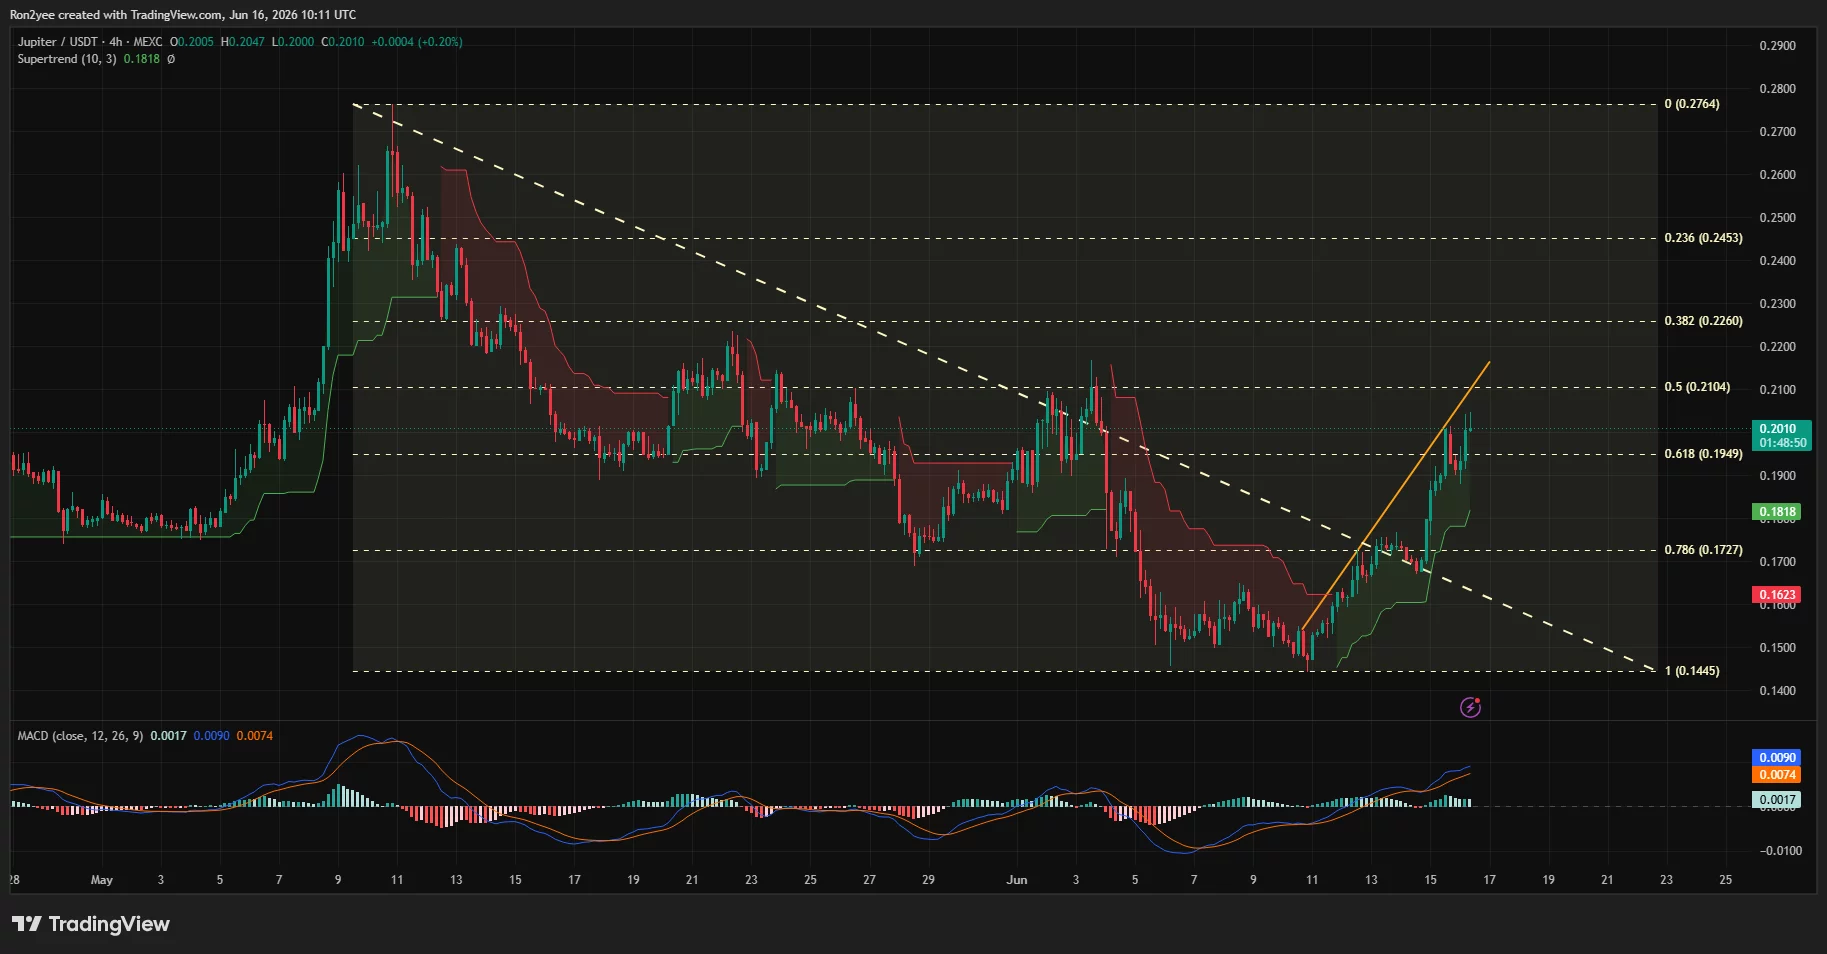
The recovery has carried the token through several important resistance levels. JUP moved above the 78.6% Fibonacci retracement level near $0.173 and later reclaimed the 61.8% retracement around $0.195 before reaching the $0.20 area.
According to chart data, the current zone around $0.20 to $0.205 has repeatedly acted as both support and resistance throughout 2026, making it one of the most important levels on the chart.
Jupiter price faces a major test at $0.20 resistance
Attention is now focused on whether buyers can secure a decisive breakout above that resistance zone.
A successful move above $0.20 could expose higher levels near $0.226 and $0.245, while the May peak around $0.276 remains the next major upside target on the daily timeframe.
Failure to hold the breakout, however, could send JUP back toward support around $0.195 and $0.173, levels that bulls reclaimed during the latest advance.
The current rally follows several months of weakness across the digital asset market. During the first half of 2026, crypto assets faced declining investor participation as institutional ETF flows slowed and capital shifted toward artificial intelligence companies and large technology listings.
The prolonged downturn removed much of the speculative excess that had built up earlier in the cycle. With market conditions improving and momentum indicators turning higher, traders are now watching whether JUP can convert its recovery into a sustained breakout above one of its most important resistance levels of the year.
Disclosure: This article does not represent investment advice. The content and materials featured on this page are for educational purposes only.


You May Also Like

DB Consulting’s Strategic Alliance with Encino Labs Elevates Local Business Search Presence

Dollar Edges Lower Ahead of Fed Decision; Yen Slips After BoJ Rate Hike

B2i Digital Highlights CitroTech’s Eco-Friendly Fire Inhibitor as Wildfire Threats Grow


