

Solana (SOL) Price: Up 20% From Its Lows — Analysts Are Now Watching This One Level
TLDR
- Solana has surged over 20% from its June low near $60, now trading around $75
- SOL is testing a key former support zone at $75.7 that could reopen a path to $83.5, $90, and $98
- Analyst Satoshi Flipper sees a falling wedge breakout pointing toward a long-term target of $250
- Analyst Daan Crypto Trades flagged SOL breaking out of a rallying wedge vs BTC, watching for follow-through
- Analyst Crypto Coral warns of a bearish flag breakdown, saying a rejection could send SOL lower
Solana has staged a sharp recovery off its June lows, climbing more than 20% in a matter of days. The move has brought SOL back to a level that could shape its next major move.
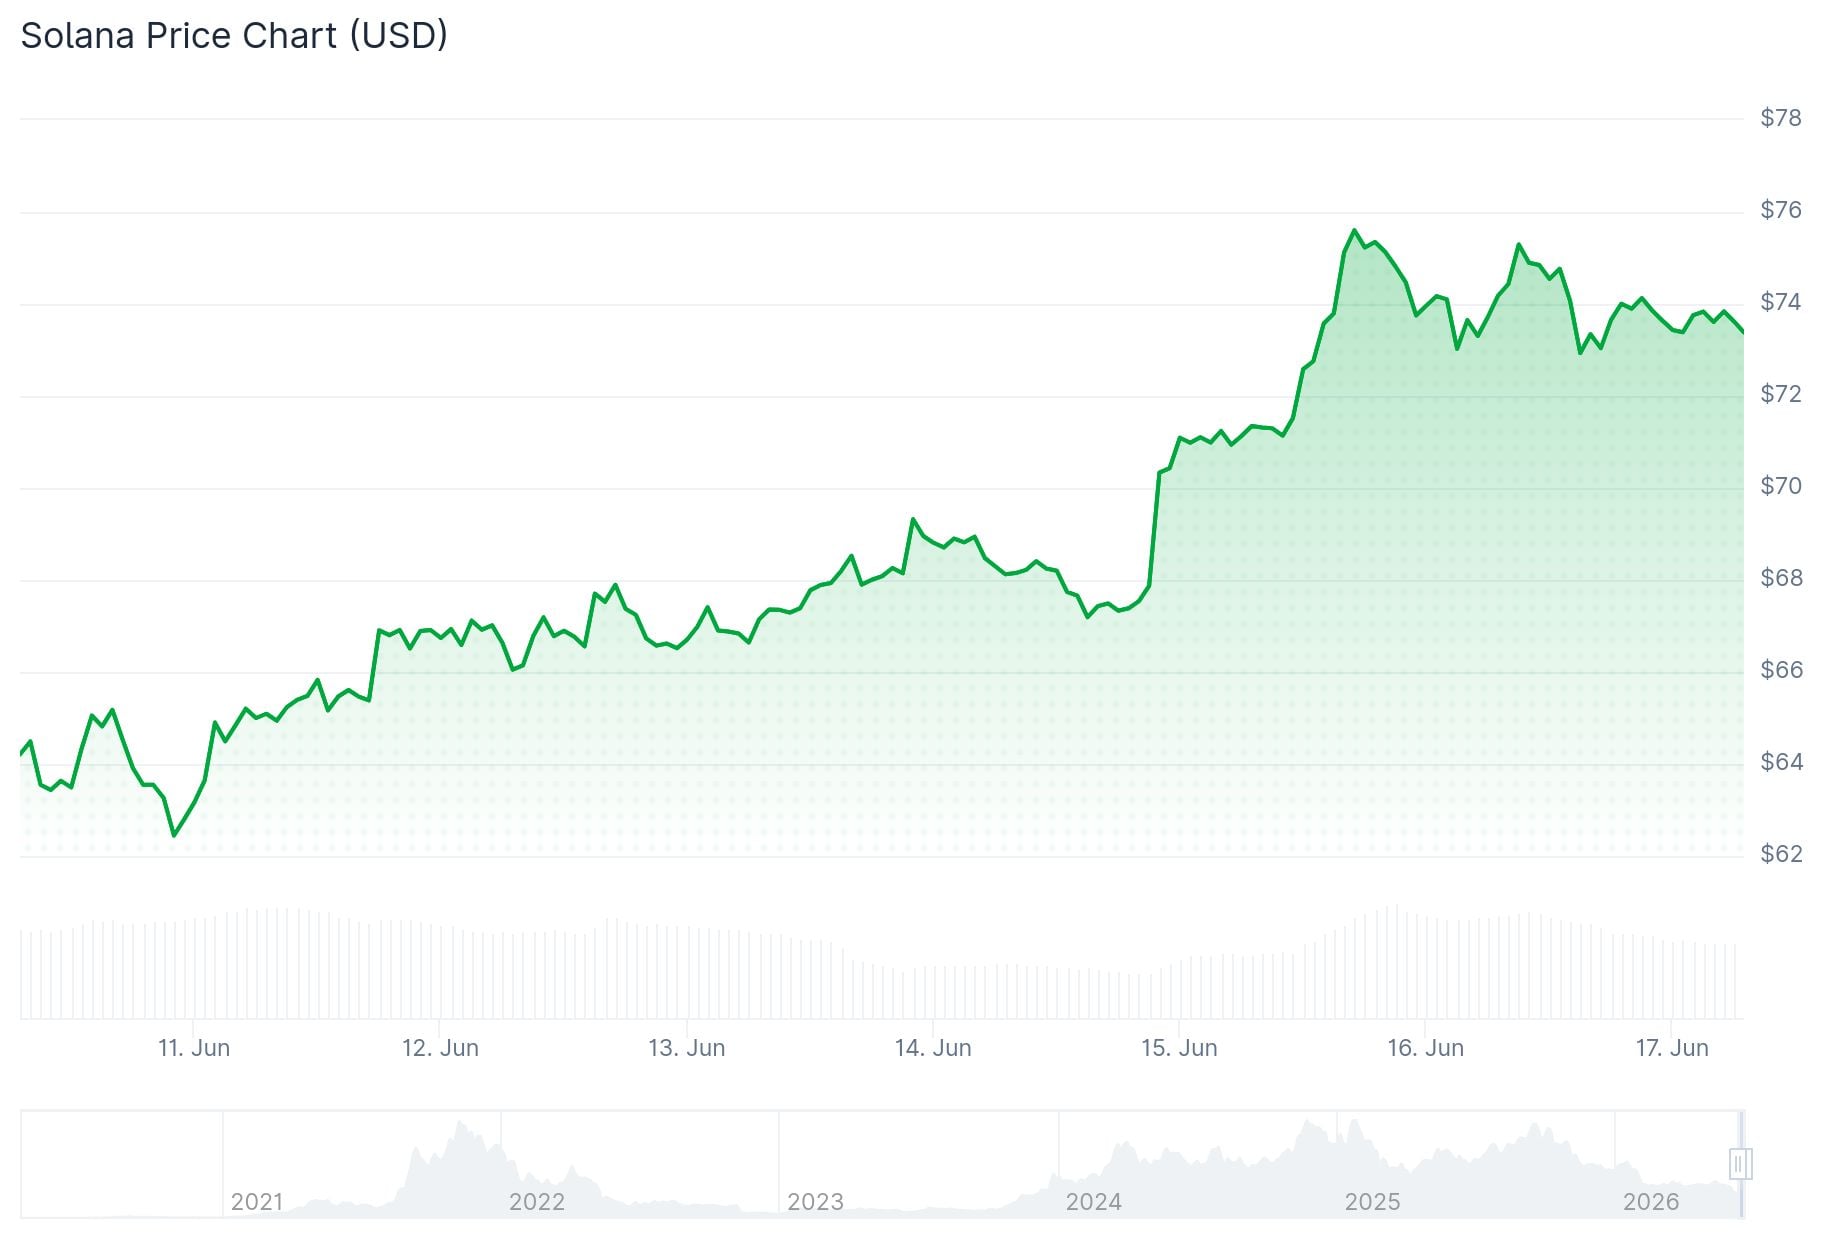 Solana (SOL) Price
As of June 16, Solana was trading around $75, up from lows near $60 set earlier in June.
The recovery was partly driven by macro news. Reports that the U.S. and Iran had reached a framework agreement to reopen the Strait of Hormuz eased inflation concerns. Oil prices fell on the news, and Bitcoin, Ethereum, and other risk assets moved higher.
Derivatives data backed the move. CoinGlass showed open interest rising alongside price during the rebound. Liquidations of short positions also helped fuel the push from the low $60s toward current levels.
On the corporate side, Solana Company rejected a non-binding acquisition proposal from Forward Industries on June 15. The offer valued the company at a premium to its market price and came as firms compete to build SOL-focused treasury strategies.
What the Charts Are Showing
On the daily chart, Solana spent nearly four months ranging between support at $75.7 and resistance at $98.3. That structure broke down in early June when price slipped below the range floor and fell toward $60.
SOL has since returned to that former support zone. A confirmed close back inside the range would invalidate the breakdown and put $83.5, $90, and eventually $98.3 back in view.
On the four-hour chart, SOL has broken above a descending trendline that had capped rallies since late May. The RSI has climbed back above 50 after touching oversold levels, and the MACD has started to turn higher.
Analyst Daan Crypto Trades posted on X that SOL is attempting a breakout from a rallying wedge it has been consolidating in against BTC. He noted that a break could lead to further upside and push some SOL ecosystem coins higher, but flagged the current area as resistance to watch.
Satoshi Flipper identified a falling wedge breakout on the daily chart, with price reclaiming the upper trendline near $70. The analyst set a long-term target at $250, a level that would represent a return to prices seen during Solana’s strongest prior cycle.
Resistance and Downside Levels to Watch
More Crypto Online highlighted a dense Fibonacci resistance cluster between $69.44 and $72.58 on the four-hour chart, where the 38.2% retracement, 100% Elliott Wave extension, and 50% retracement levels converge.
Not all analysts are bullish. Crypto Coral warned on June 16 that Solana had broken down from a bearish flag and is retesting key EMA resistance. The analyst said unless bulls reclaim that level, another leg lower is possible.
If $75 fails to hold as support, the next levels to watch are $71.8, $69.1, and then the June low near $60.
The Supertrend indicator on the four-hour chart currently shows support near $70.9.
The post Solana (SOL) Price: Up 20% From Its Lows — Analysts Are Now Watching This One Level appeared first on CoinCentral.


You May Also Like

Eurozone Inflation Climbs to 3.2% in May Amid Iran Conflict and Energy Crisis

NetJets Business Jet Crashes On Texas Highway

Moody’s Assigns First-Ever Rating to Bitcoin-Backed Municipal Bond in Historic Crypto Finance Move


