

Price Analysis June 17: BTC, ETH, BNB, XRP, SOL as Traders Assess Key Support Levels Amid Market Pullback
The cryptocurrency market traded lower over the past 24 hours, with Bitcoin and major altcoins extending losses as investors remained cautious amid broader market uncertainty. As of 9:48 AM UTC, increased trading volumes across several leading cryptocurrencies indicated heightened market activity during the decline, suggesting traders were actively repositioning rather than waiting on the sidelines. While the latest sell-off has affected the broader market, each major cryptocurrency is approaching important technical areas that could influence short-term sentiment and trading behavior.
Bitcoin Price Analysis
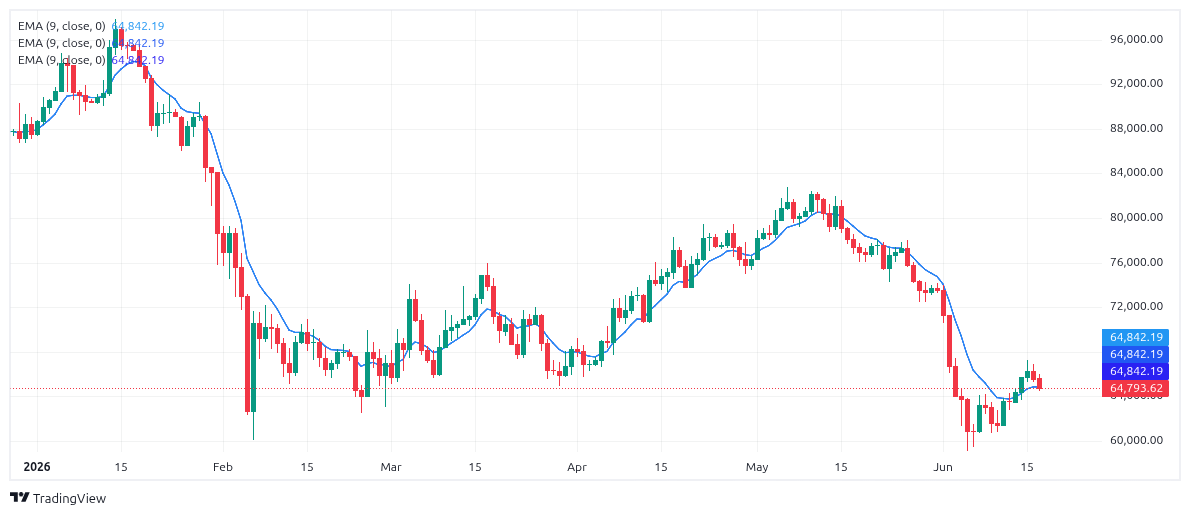
Bitcoin (BTC) fell 2.49% over the past 24 hours to trade at $64,919.36, reducing its market capitalization to approximately $1.3 trillion. Despite the decline, daily trading volume rose 24.84% to $23.92 billion, highlighting increased participation as prices moved lower.
 BTC Chart TradingView
The latest weakness coincides with renewed selling pressure from institutional investors after U.S. spot Bitcoin ETFs recorded roughly $64 million in net outflows. Additional pressure came from broader market caution and liquidations of leveraged positions, which accelerated downside momentum.
From a price-action perspective, Bitcoin is trading near the psychologically important $64,000 region. This area has attracted buyers during previous pullbacks and now represents a critical zone where market participants are assessing demand. Increased volume during the decline suggests sellers remain active, but the concentration of trading activity near support may also indicate accumulation attempts by longer-term investors. A similar dynamic was observed on June 4, when Bitcoin plunged 6.58% and briefly traded below $63,000 before attracting renewed buying interest. The inability to sustain prices above recent highs has shifted short-term momentum in favor of sellers, although Bitcoin continues to trade above major long-term support levels.
Ethereum Price Analysis
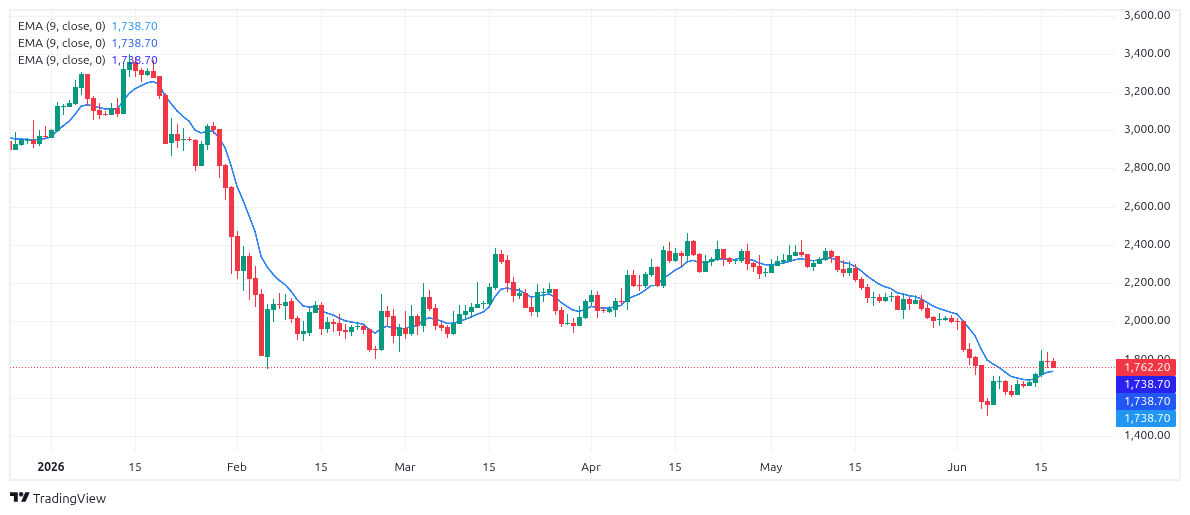
Ethereum (ETH) traded at $1,771.98, down 0.86% during the past 24 hours. Its market capitalization declined to approximately $213.85 billion, while daily trading volume surged 32.72% to $12.78 billion.
 ETH Chart TradingView
Unlike Bitcoin, Ethereum’s decline was relatively modest, suggesting that some investors remain willing to accumulate at lower levels. However, the rise in trading volume indicates that both buyers and sellers are becoming more active as the asset approaches an important technical area. The broader market sell-off and cautious sentiment ahead of macroeconomic developments have weighed on Ethereum, while profit-taking following previous recovery attempts has limited upside momentum.
Price action shows Ethereum hovering near the $1,760 region, a level closely watched by traders due to its role in recent market structure. Sustained trading around this zone suggests a battle between buyers attempting to stabilize the market and sellers seeking additional downside.
BNB Price Analysis
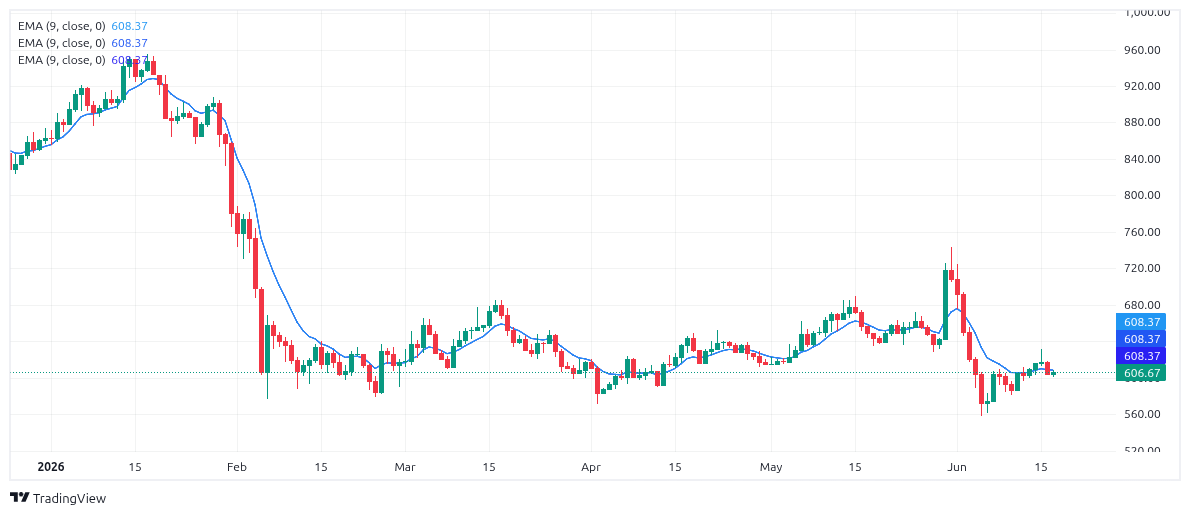
BNB declined 2.24% over the past day to $601.37, bringing its market capitalization to approximately $81.05 billion. Trading volume increased 13.39% to $1.25 billion, reflecting active participation despite the broader market weakness.
 BNB Chart TradingView
The token has faced pressure from both market-wide risk aversion and concerns surrounding Binance’s regulatory outlook in Europe. Reports regarding potential challenges related to MiCA licensing, along with increased attention on Binance’s broader business initiatives, including its links to stock trading infrastructure and the emerging Binance stock brokerage narrative, have contributed to cautious sentiment among traders.
Technically, BNB remains above the important $600 level, but recent price action indicates weakening bullish momentum. The increase in volume during the decline suggests market participants are actively responding to news developments and changing risk conditions. While sellers currently control short-term momentum, BNB continues to trade within a broader range that has defined its recent market structure.
XRP Price Analysis
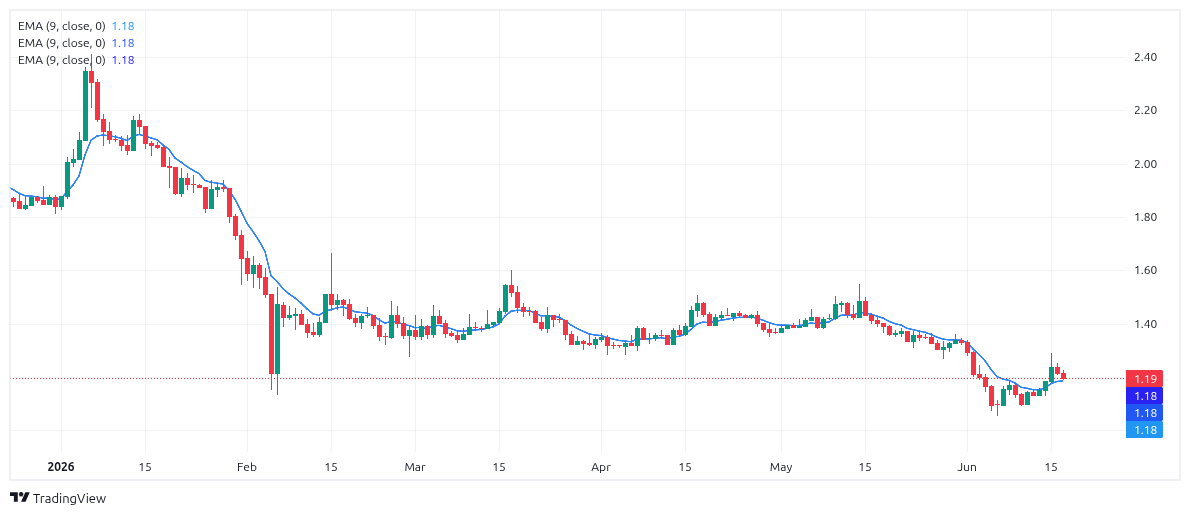
XRP traded at $1.19, down 3.51% over the last 24 hours, making it one of the weakest performers among large-cap cryptocurrencies. Market capitalization fell to approximately $74.2 billion, while trading volume jumped 46.87% to $1.66 billion.
 XRP Chart TradingView
The decline followed XRP’s inability to maintain momentum above the $1.22-$1.25 region, where selling pressure intensified. The sharp increase in volume suggests that many traders used the recent recovery as an opportunity to secure profits, resulting in stronger downside pressure.
Current price action reflects a market attempting to establish a new equilibrium after the recent rejection from higher levels. Elevated volume during the decline indicates conviction among sellers, although it also highlights growing interest around current prices. Traders are closely monitoring how XRP behaves around the $1.20 area, which has emerged as an important short-term reference point for market sentiment. Meanwhile, the XRP Ledger upgrade has drawn attention across the ecosystem, as network improvements aimed at addressing NFT and lending-related issues could help strengthen confidence despite broader market volatility.
Solana Price Analysis
Solana (SOL) fell 3.42% during the past 24 hours to trade at $72.35. The asset’s market capitalization stood at approximately $41.97 billion, while daily trading volume increased 28.27% to $2.07 billion.
 SOL Chart TradingView
The decline reflects both broader cryptocurrency market weakness and softer sentiment across segments of the Solana ecosystem. Reduced speculative activity, particularly in high-risk trading sectors, has contributed to weaker short-term demand.
Price action shows Solana approaching the lower end of its recent trading range after failing to sustain momentum above nearby resistance levels. The increase in trading volume suggests that market participants remain highly engaged despite declining prices. This marks a notable shift from late last month, when Solana (SOL) held above $83, highlighting the extent of the recent pullback.
The area around $70 has become an important focus for traders, as it represents a zone where buyers previously showed interest. Whether buying demand returns near current levels could play a significant role in determining short-term market direction.
Market Overview
The cryptocurrency market remains under pressure as investors navigate institutional outflows, macroeconomic uncertainty, and weakening risk appetite. Rising trading volumes across Bitcoin, Ethereum, XRP, and Solana suggest that market participants are actively adjusting positions rather than waiting for clearer direction.
Bitcoin continues to set the tone for the broader market, while Ethereum, BNB, XRP, and Solana are all trading near levels that traders view as technically significant. Although current momentum favors sellers, increased activity near key price zones indicates that market participants are closely evaluating whether the latest decline represents continued weakness or an opportunity to accumulate at lower levels.


You May Also Like
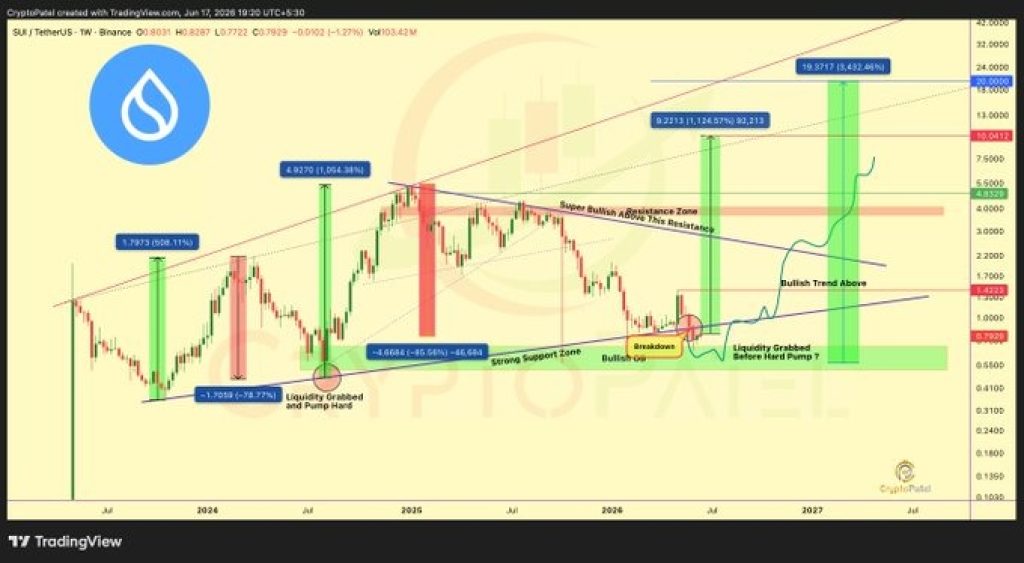
SUI Price Prediction: Analyst Says a 10X Rally Is Still Possible

Best Music AI Websites For Songs And Soundtracks

British Pound Slides as Warsh’s Hawkish Fed Stance Boosts US Dollar


