

Solana (SOL) Price Fails at a Crucial Level Again and Now Trouble May Be Ahead
Solana price has spent the past few days fighting against an important resistance zone, as buyers have struggled to gain control. Price action shows repeated rejection near key levels, and several technical indicators now point toward additional weakness in the short term.
That outlook becomes even more interesting because Solana recently bounced strongly from its lows. What initially looked like the beginning of a broader recovery is now facing a serious test as resistance continues to hold firm.
Crypto analyst Ali Charts pointed to this setup on Friday. At the time, Solana had just completed an 8.4% recovery after a validated TD Sequential buy signal. SOL price climbed from $68.46 to a high of $74.27, creating optimism that buyers could continue pushing higher.
That recovery, however, ran directly into a major technical barrier. Ali Charts explained that a TD Sequential sell signal appeared as Solana tested resistance near $74.65. That resistance became even more important because it aligned closely with the 4 hour 200 Simple Moving Average near $75.
When multiple technical barriers cluster within the same area, price often struggles to continue moving higher.
Ali Charts noted that the setup favored a pullback toward $71, with a deeper decline potentially revisiting Friday’s low near $68.
His latest update remains simple and direct: “Resistance looks hard to break,” and price action suggests that assessment remains valid.
Solana Price Continues To Struggle After Three Consecutive Days Of Weakness
A wider look at Solana price reveals a market that has been gradually losing strength. SOL price has now declined for three consecutive days. The latest drop follows several failed attempts to break above resistance near $74.
Every rejection from that area increased selling pressure. Eventually, Solana price slipped back toward the $70 zone, where it currently trades.
The next important question involves support. The $70 level remains a critical area for buyers. Continued weakness could eventually force SOL price below that support. Such a move would likely open the path back toward the $67 region.
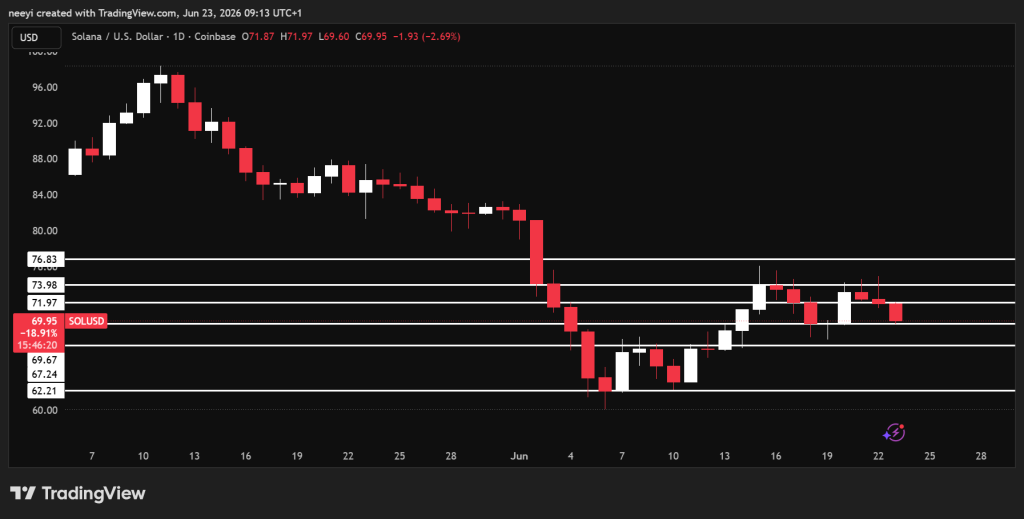 SOL Price Chart / TradingView.com
That level deserves special attention because it previously acted as a strong support area.
A successful defense of $67 could allow Solana price to stabilize and potentially begin another recovery attempt.
The situation becomes more concerning if sellers push below $67. That breakdown could expose Solana to a deeper decline toward $62, which sits close to the month’s low. Such a move would likely unfold over several trading sessions instead of occurring immediately.
Read Also: Bitcoin Price News: BTC Faces Key Resistance as Strategy Expands Reserves and BlackRock Launches Income ETF
Solana Price Indicators Continue To Support A Cautious Outlook
Several technical indicators help explain why the near-term outlook remains cautious.
The Relative Strength Index currently stands at 43.86. That reading places momentum below the midpoint without entering oversold territory. Buyers still have room to defend support, but strength remains limited.
The Awesome Oscillator sits at negative 2.80. This reading shows that bearish pressure remains present even though conditions are not extreme.
Momentum registers 1.23. The indicator continues to point toward weakness despite recent recovery attempts.
Bull Bear Power comes in at negative 0.59. This metric shows sellers still maintain an advantage in the current market structure.
The Ultimate Oscillator stands at 44.85. That reading remains below the neutral midpoint and suggests buyers have not fully regained control.
| Indicator Name | Metric | Interpretation |
|---|---|---|
| Relative Strength Index (14) | 43.86 | Momentum remains below the midpoint without reaching oversold levels |
| Awesome Oscillator | -2.80 | Bearish pressure remains present in the market |
| Momentum (10) | 1.23 | Recovery attempts continue to face resistance |
| Bull Bear Power | -0.59 | Sellers maintain a modest advantage |
| Ultimate Oscillator (7, 14, 28) | 44.85 | Buying strength remains limited |
Market behavior places Solana at an important crossroads. Resistance near $74 continues to block recovery attempts, which aligns closely with the observations made by Ali Charts. Price has already retreated toward $70 after multiple rejections, and that support now carries greater importance than ever.
A successful defense of $70 and eventually $67 could allow SOL price to stabilize and prepare for another attempt higher. Failure to hold those levels would place the monthly low near $62 back into focus.
FAQs
Subscribe to our YouTube channel for daily crypto updates, market insights, and expert analysis.
The post Solana (SOL) Price Fails at a Crucial Level Again and Now Trouble May Be Ahead appeared first on CaptainAltcoin.


You May Also Like

Carnival (CCL) Stock: Revenue Miss Overshadows Earnings Beat as Shares Slide
Target (TGT) Stock Surges After Wolfe Research Elevates Rating to Outperform
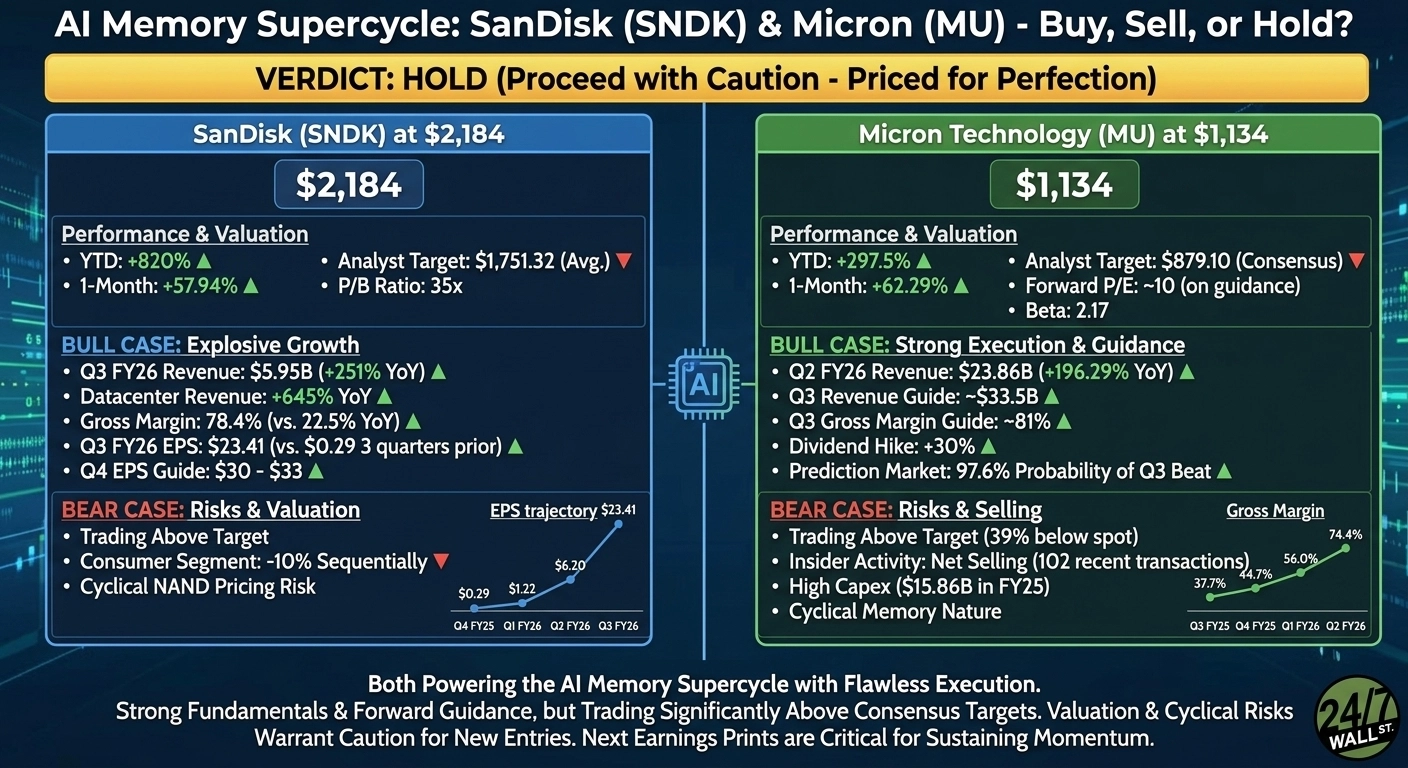
Buy, Sell, or Hold: SanDisk at $2,184 and Micron at $1,134


