

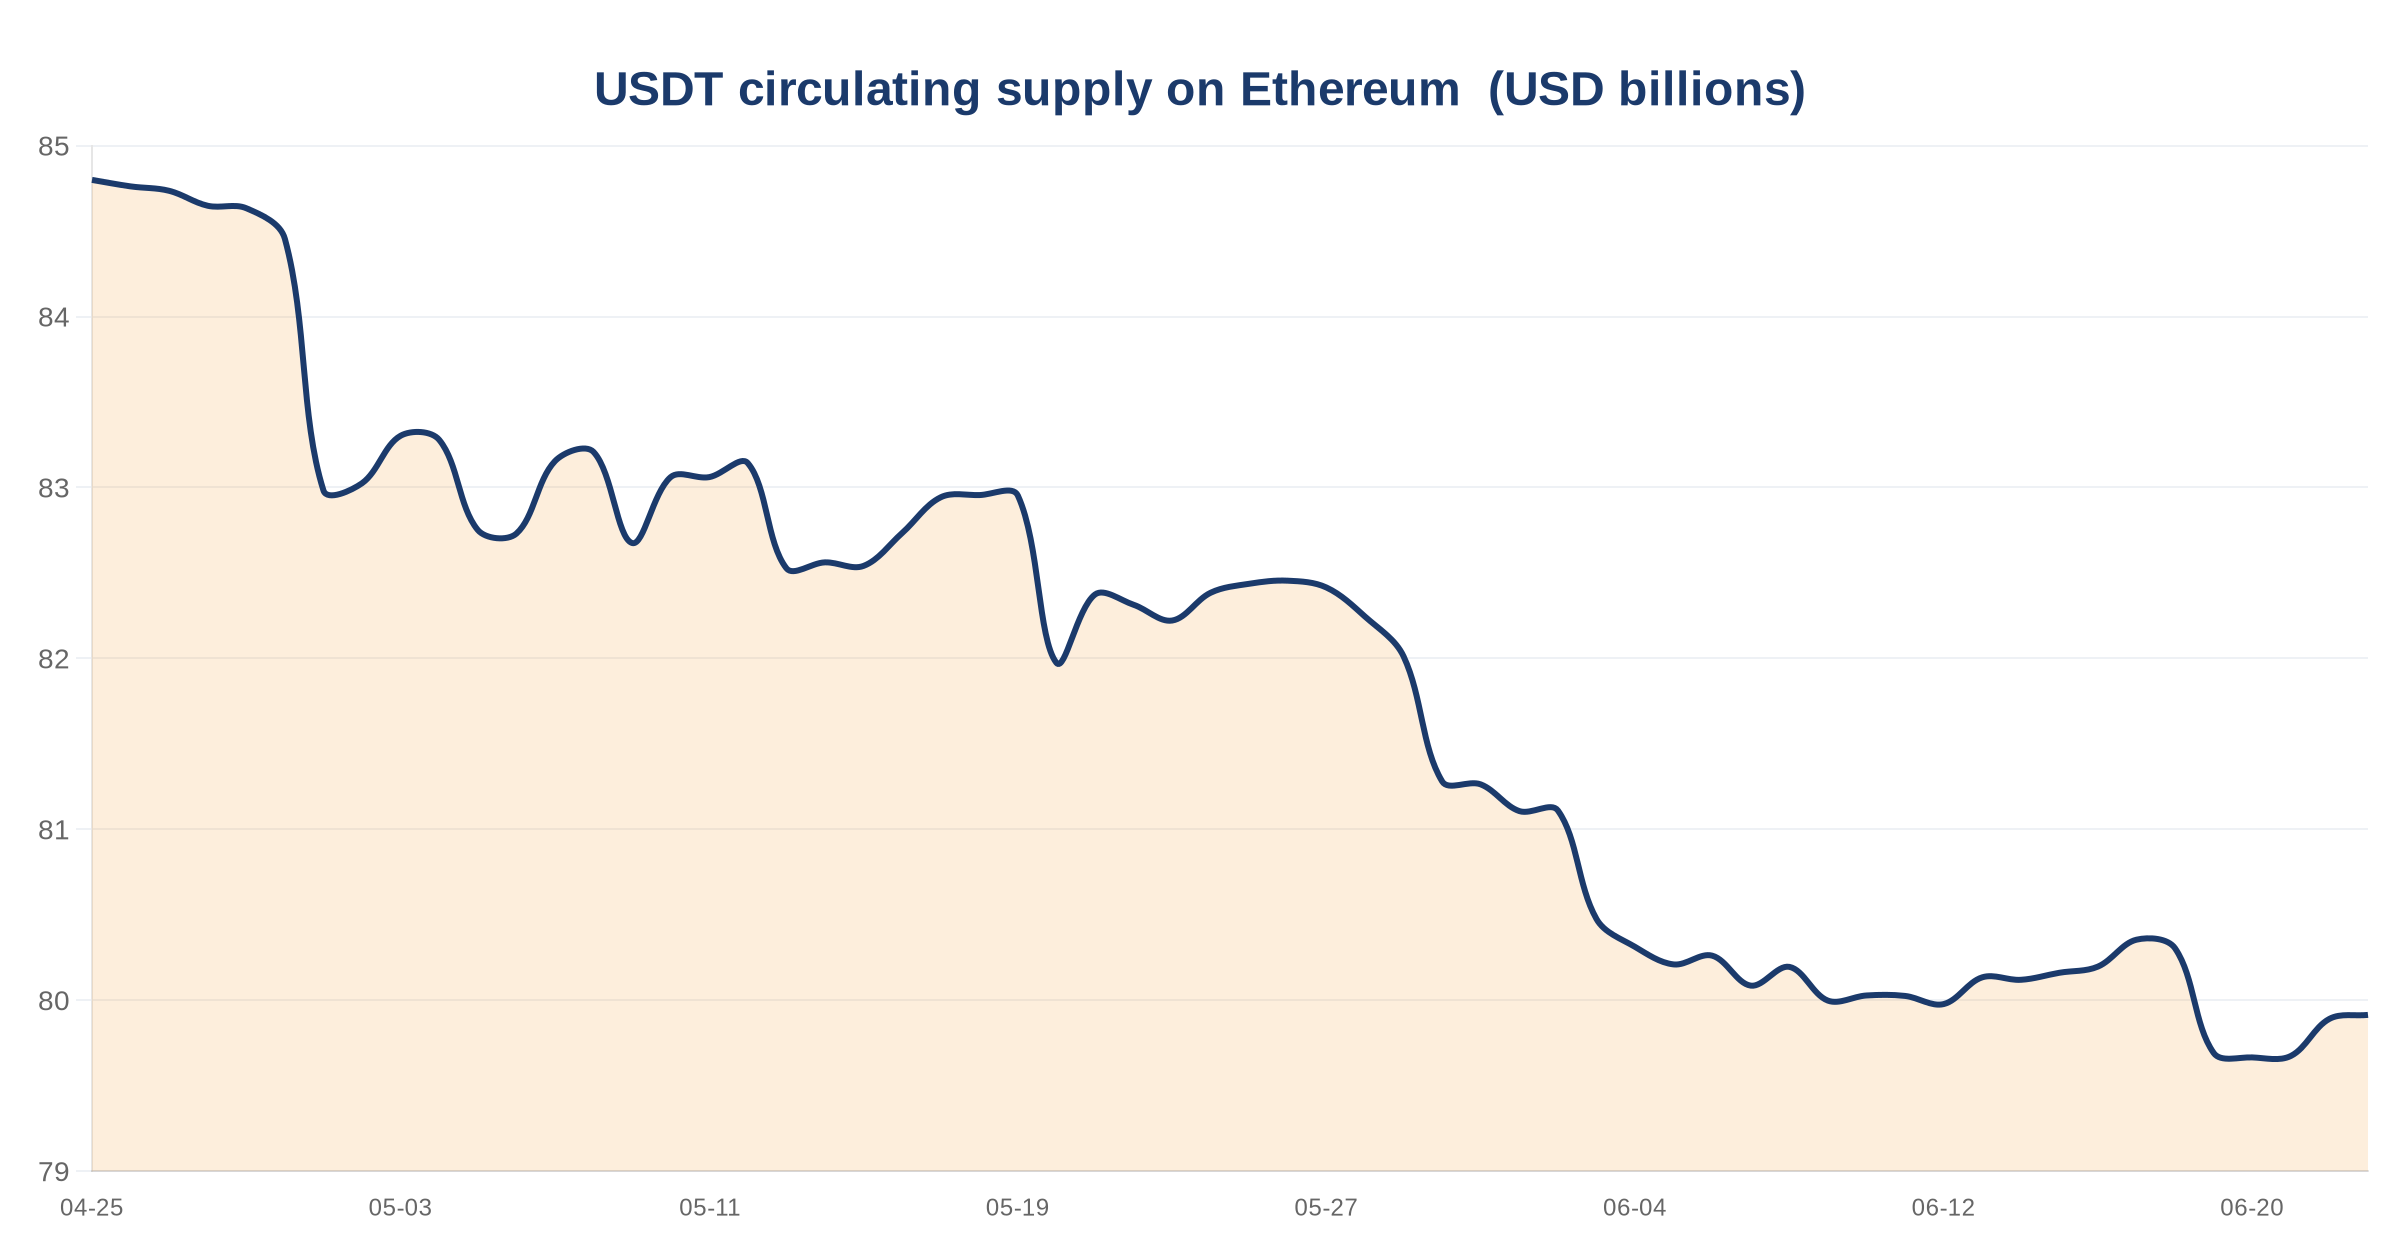
Ethereum USDT Supply Declines 3% in 30 Days to $79.91B, Maintaining 42.89% Share of Global Circulation
Key takeaways
- USDT circulating supply on Ethereum declined 3.01% over 30 days to $79.91B as of June 23, 2026, down from $82.38B on May 24, 2026.
- Ethereum accounts for 42.89% of the global USDT circulation of $186.30B as of June 23, 2026.
- Total USD-pegged stablecoin supply on Ethereum reached $156.45B as of June 23, 2026, with USDT representing just over half of that amount.
Ethereum USDT Supply Contracts 3% in Thirty Days, Still Holds 42.89% of Global Circulation
The amount of USDT held on Ethereum has fallen over the past month, offering a concrete signal of shifting stablecoin dynamics on the network. Between 24 May 2026 and 23 June 2026, the circulating supply of USDT on Ethereum dropped from $82.38B to $79.91B — a decline of 3.01%, or roughly $2.47B in absolute terms. Despite that contraction, Ethereum retains a substantial portion of all USDT in existence.
The Numbers in Context
As of 23 June 2026, USDT’s circulating supply on Ethereum stands at $79.91B, against a total global USDT circulation of $186.30B. That means Ethereum accounts for 42.89% of every USDT dollar currently in circulation across all networks — a chain share that underscores how central Ethereum remains to USDT’s overall footprint even as its supply shrinks in nominal terms.
Ethereum’s broader stablecoin picture provides additional context. The total circulating supply of USD-pegged stablecoins on Ethereum reached $156.45B as of the same date. USDT’s $79.91B therefore represents just over half of all dollar-pegged stablecoin supply sitting on the Ethereum network, with the remaining share made up by other USD-pegged assets.
Key Figures at a Glance
- USDT on Ethereum (23 June 2026): $79.91B
- USDT on Ethereum (24 May 2026): $82.38B
- 30-day change: −3.01% (−$2.47B)
- Global USDT circulation: $186.30B
- Ethereum’s share of global USDT: 42.89%
- Total USD-pegged stablecoin supply on Ethereum: $156.45B
Reading the Trend
A 3.01% decline over thirty days is a measurable move in a market where stablecoin supplies tend to shift gradually. The contraction from $82.38B to $79.91B indicates that more USDT left the Ethereum network than arrived during the period — whether through redemptions, bridging activity to other chains, or reduced demand for on-chain dollar liquidity on Ethereum specifically. The data does not specify the mechanism, only the net outcome.
What the figures do make clear is that the decline has not materially eroded Ethereum’s dominant position within the global USDT distribution. Holding 42.89% of a $186.30B total means Ethereum’s share remains well above any single-chain majority threshold, even after the monthly dip in supply.
Why It Matters
USDT supply on a given chain is a widely watched proxy for the depth of dollar liquidity available to that network’s users and protocols. A sustained contraction can point to reduced trading activity, lower demand for collateral, or migration of liquidity to competing chains. The 3.01% decline over the measured period is notable precisely because it occurs against a backdrop of $156.45B in total USD-pegged stablecoin supply on Ethereum — meaning other dollar-pegged assets on the network did not necessarily follow the same trajectory. Tracking whether Ethereum’s 42.89% global USDT share continues to hold or begins to erode will be a key on-chain metric in the weeks ahead.
Disclaimer: Market data is informational only and not investment advice. Figures are accurate as of the stated dates and change continuously.
 On-chain data — see Data & sources below.
Featured illustration is AI-generated.
Frequently Asked Questions
How much did Ethereum’s USDT supply change in the last 30 days?
Ethereum’s USDT supply declined 3.01% over 30 days, falling from $82.38B on May 24, 2026 to $79.91B on June 23, 2026—a decrease of roughly $2.47B in absolute terms.
What percentage of global USDT circulates on Ethereum?
Ethereum accounts for 42.89% of global USDT circulation, holding $79.91B out of a total global supply of $186.30B as of June 23, 2026.
How much of Ethereum’s stablecoin supply is USDT?
USDT represents just over half of the $156.45B in total USD-pegged stablecoin supply on Ethereum, with USDT accounting for $79.91B of that total as of June 23, 2026.
Data & sources
Every figure in this article is pulled from live on-chain data and linked to its source and the date it was read.
- Total stablecoin supply on chain: $156.45B (as of 2026-06-23) — source [API]
- Stablecoin supply on chain: $79.91B (as of 2026-06-23) — source [API]
- Stablecoin 30-day supply change: -3.01% (as of 2026-06-23) — source [API]
- Stablecoin chain share: +42.89% (as of 2026-06-23) — source [API]
Methodology: every figure above links to its live on-chain source (DeFiLlama, CoinGecko) and the date it was read; analysis by Blockchain Magazine. Informational only, not investment advice.


You May Also Like

New Cryptocurrency 2026: 540K Tokens Die, Pepeto Listing Nears
RTX Stock Has a $271 Billion Backlog and a 19% Drawdown. Does the Defense Supercycle Justify Buying at $186?

European Union’s ESMA Orders Unlicensed Crypto Firms to Exit EU Market as MiCA Deadline Arrives


