

Shopify Stock Trapped Below All Key EMAs Despite $5B Buyback

Shopify stock closed at $107.98 on June 22, pinned below its 20-day, 50-day, and 200-day exponential moving averages. With every major EMA stacked overhead as resistance, the daily bias remains firmly bearish unless buyers reclaim the $110–$111 zone.
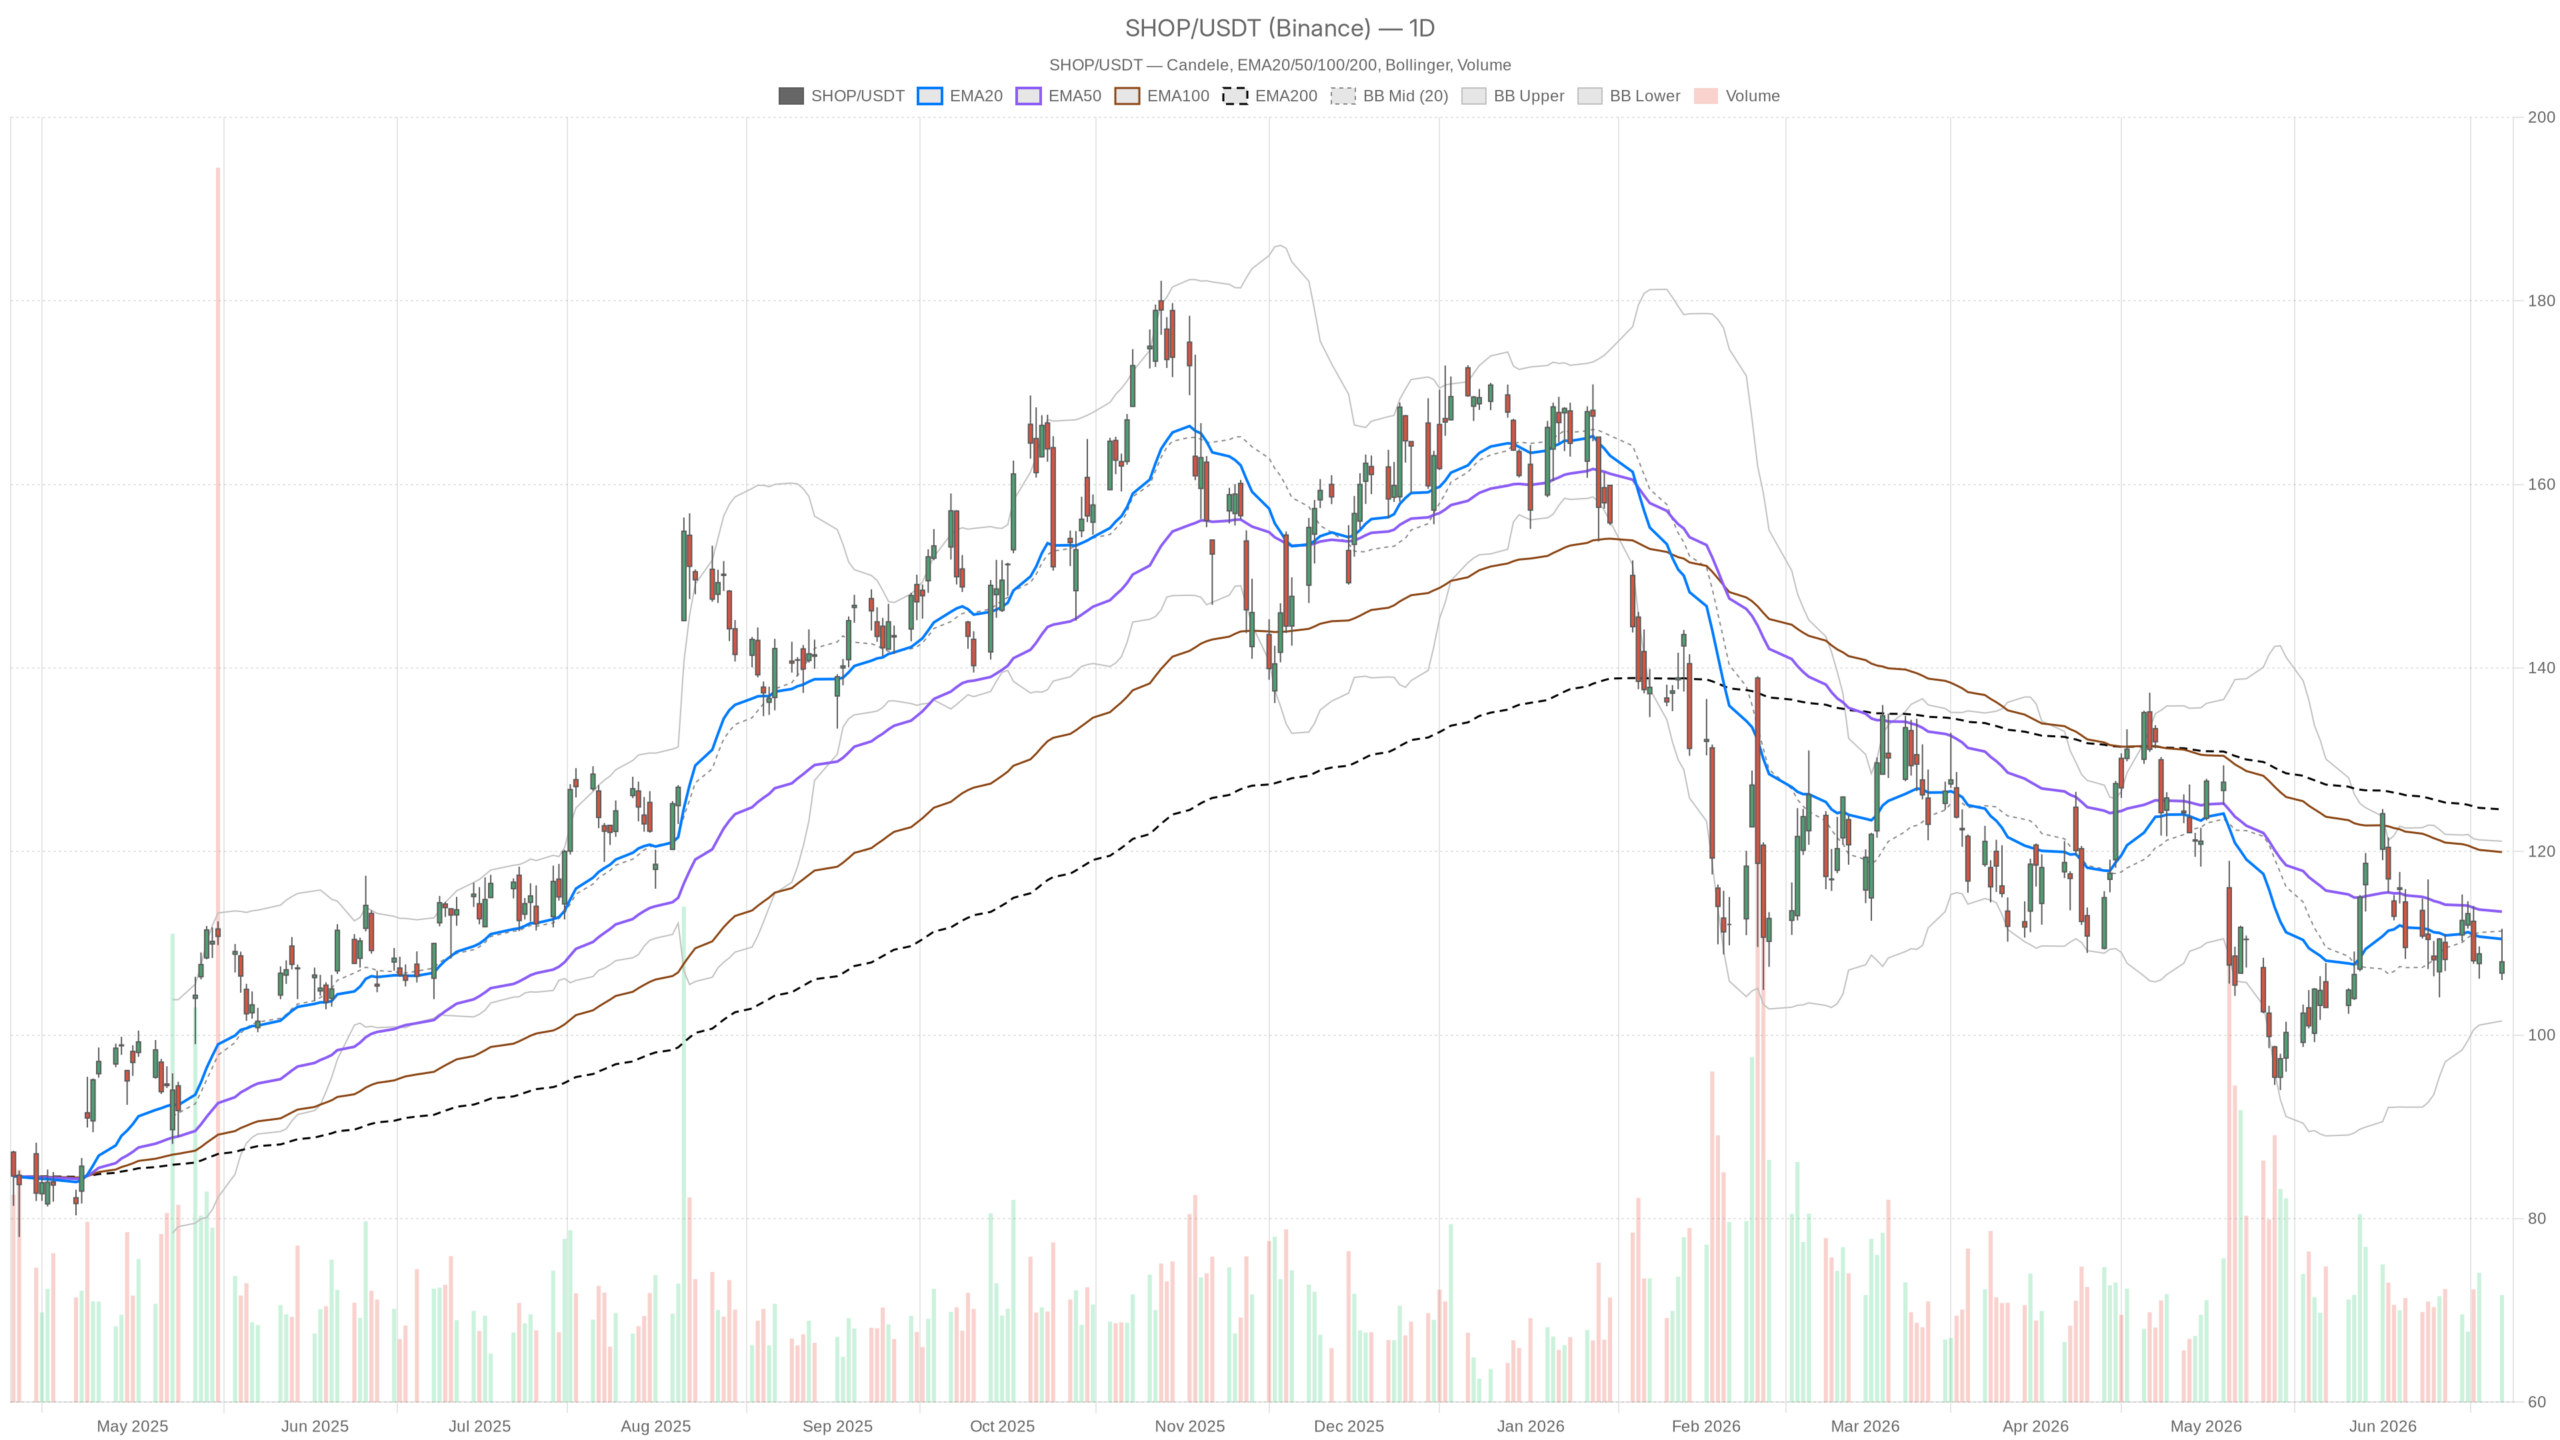 SHOP — daily chart with candlesticks, EMA20/EMA50 and volume.
Key takeaways
- SHOP trades below all three major daily EMAs — the 20-day at $110.46, 50-day at $113.45, and 200-day at $124.59.
- Daily RSI at 46.2 leaves room for further downside before oversold conditions emerge.
- A $5 billion share buyback program provides fundamental support beneath the technical weakness.
- The bearish scenario remains the path of least resistance while SHOP stays below $111.
Daily Chart Structure: Shopify Stock Remains Trapped Below Key Averages
The daily chart shows Shopify stock trapped in a bearish configuration, with every major moving average acting as overhead resistance that SHOP has failed to reclaim.
The EMA20 sits at $110.46, the EMA50 at $113.45, and the EMA200 at $124.59. Each one functions as a ceiling. Shopify stock is not merely below these levels — it is losing ground against them. That kind of moving average arrangement reflects sustained selling pressure, not a temporary dip. Price continues to drift lower within a clearly defined downtrend structure.
Momentum Indicators Confirm Bearish Pressure on Shopify Stock
Momentum indicators on the daily chart reinforce the bearish outlook for Shopify stock, with neither RSI nor MACD offering signs of an imminent reversal.
The daily RSI at 46.2 sits in neutral-to-weak territory. It has not yet reached oversold conditions, which is actually a concern for bulls. Room exists to the downside before any technical bounce becomes statistically compelling. The MACD reinforces this view. The MACD line is at -0.75, below the signal at -0.60, and the histogram prints a slightly negative -0.15. Momentum is not accelerating downward but it is not reversing either.
Bollinger Bands and Volatility Context
Bollinger Bands add further context. The midline is at $111.33 — comfortably above current price. SHOP closed near $107.98, placing it in the lower half of the band. The lower band at $101.54 suggests there is still meaningful downside room before price becomes statistically stretched. The upper band at $121.12 is effectively irrelevant for now. Daily ATR at $5.77 confirms that volatility remains elevated. Intraday swings of several dollars are entirely normal within this bearish regime.
Pivot Levels Define Immediate Support and Resistance for SHOP
The daily pivot framework places immediate resistance at $111.04 and support at $105.46, with Shopify stock failing to hold even short-term equilibrium below the central pivot.
On the pivot level framework, the daily pivot point sits at $108.52. SHOP closed just below it at $107.98. That minor breach carries weight — the stock is failing to hold even short-term equilibrium. R1 resistance at $111.04 and S1 support at $105.46 define the immediate range. A decisive close below $105.46 would open the door to further technical deterioration.
Hourly and Intraday Timeframes Reinforce Bearish Momentum in Shopify Stock
The 1-hour chart strengthens the bearish case for Shopify stock, while the 15-minute chart offers only a brief pause rather than a reversal signal.
1-Hour Chart: Bears Remain in Control
Shifting to the 1H timeframe, the bearish case strengthens rather than softens. The hourly EMA20 is at $108.91, EMA50 at $109.97, and EMA200 at $111.74 — all above price and sloping lower. The 1H RSI at 40.58 is approaching oversold territory but has not reached it yet. This suggests continued near-term weakness without an immediate catalyst for a bounce. The hourly MACD line at -0.91 trails the signal at -0.85, and the histogram at -0.07 shows no meaningful recovery impulse building.
15-Minute Chart: A Brief Pause, Not a Reversal
In contrast, the 15-minute chart introduces a small wrinkle worth acknowledging. The M15 regime is classified as neutral, and the MACD histogram has turned slightly positive at +0.13. The 15m RSI is nearly balanced at 49.61. This does not change the broader picture. However, it does suggest that very short-term momentum has steadied. For active traders, a minor intraday bounce toward the $108.30–$108.50 range is plausible before the next directional move resolves.
Fundamental Support: Buyback Program Underpins Shopify Stock
Shopify’s recently authorized $5 billion share buyback program provides a credible fundamental floor beneath the technical weakness, though it has not yet halted the downtrend.
On the fundamental side, Shopify’s recent corporate actions add an interesting layer. The company has authorized a $5 billion share buyback program — a substantial commitment signaling management confidence in the stock’s long-term value. At the 2026 annual shareholder meeting, governance items passed smoothly and the board was fully reelected. Meanwhile, Shopify announced plans to bar vape products from its platform in response to U.S. regulatory pressure. This move reflects proactive compliance rather than a reactive posture. These are not catalysts that typically move a stock in a single session. Still, they do reduce headline risk.
Nevertheless, buyback announcements do not automatically halt technical downtrends. The market discounts these positives against a backdrop of persistent technical weakness. The gap of roughly $16.60 between current price and the EMA200 at $124.59 represents months of underperformance that corporate governance alone will not reverse.
Bullish and Bearish Scenarios for Shopify Stock
The bearish scenario remains the path of least resistance for Shopify stock, while bulls need a convincing reclaim of the $110–$111 zone to shift sentiment.
What Needs to Happen for Bulls
For the bullish scenario to materialize, SHOP must reclaim the daily pivot at $108.52 convincingly. It would then need to push through R1 at $111.04. A close above the EMA20 at $110.46 on the daily would be the first real signal that sentiment is shifting. The $5 billion buyback program provides mechanical support. Sustained repurchases at current levels could gradually absorb selling pressure and stabilize the stock. An improvement in the daily RSI above 50 would confirm buyers are genuinely gaining ground.
Why Bears Still Hold the Upper Hand
On the other hand, the bearish scenario requires far less to play out. SHOP simply needs to remain below its moving averages and lose the $105.46 S1 support level. A breakdown there, particularly on elevated volume, would expose the lower Bollinger Band at $101.54 as the next meaningful reference point. The daily ATR of $5.77 means such a move could develop rapidly. With the 1H regime firmly bearish and momentum still pointing down, this is the path current price action implicitly prices in.
FAQ
Is Shopify stock currently in a bearish trend?
Yes. Shopify stock closed at $107.98 on June 22, trading below its 20-day EMA ($110.46), 50-day EMA ($113.45), and 200-day EMA ($124.59). All three moving averages are sloping downward, confirming a bearish daily bias.
What are the key support levels for SHOP?
The immediate support is the daily S1 pivot at $105.46. Below that, the lower Bollinger Band at $101.54 represents the next meaningful downside reference. A decisive close beneath $105.46 would signal further technical deterioration.
Could the $5 billion buyback program reverse Shopify stock’s downtrend?
The buyback program provides fundamental support and signals management confidence, but it has not yet halted the technical downtrend. Sustained repurchases could gradually absorb selling pressure. However, a trend reversal would require SHOP to reclaim the $110–$111 resistance zone first.
What needs to happen for Shopify stock to turn bullish?
SHOP must reclaim the daily pivot at $108.52, close above the EMA20 at $110.46, and push through R1 at $111.04. An improvement in the daily RSI above 50 would confirm buyers are gaining ground.
Disclaimer: This article is for informational purposes only and does not constitute financial advice, an investment recommendation, or a solicitation to buy or sell any financial instrument or cryptocurrency. The analysis provided is not indicative of future results. Investing in crypto assets and financial markets carries a high risk of capital loss. Always do your own research (DYOR) and consult a qualified financial advisor before making any decision.
Article produced with the assistance of artificial intelligence and reviewed by the editorial team.


You May Also Like

Euro Slips Against Japanese Yen as German Manufacturing PMI Stalls in June

Japanese Tech Giant’s Ambitious Bitcoin Accumulation
SpaceX Bond Offering Draws $85B in Orders for a $25B Raise


