

Celebras Stock Sinks 9% as Q1 Margin Miss Overshadows $20B AI Deal

Celebras stock faces a bearish daily setup heading into late June. A disappointing Q1 margin outlook rattled sentiment after hours. Meanwhile, a $20 billion OpenAI–AWS partnership creates headline optimism. The chart remains technically weak, and the fundamental picture is unresolved.
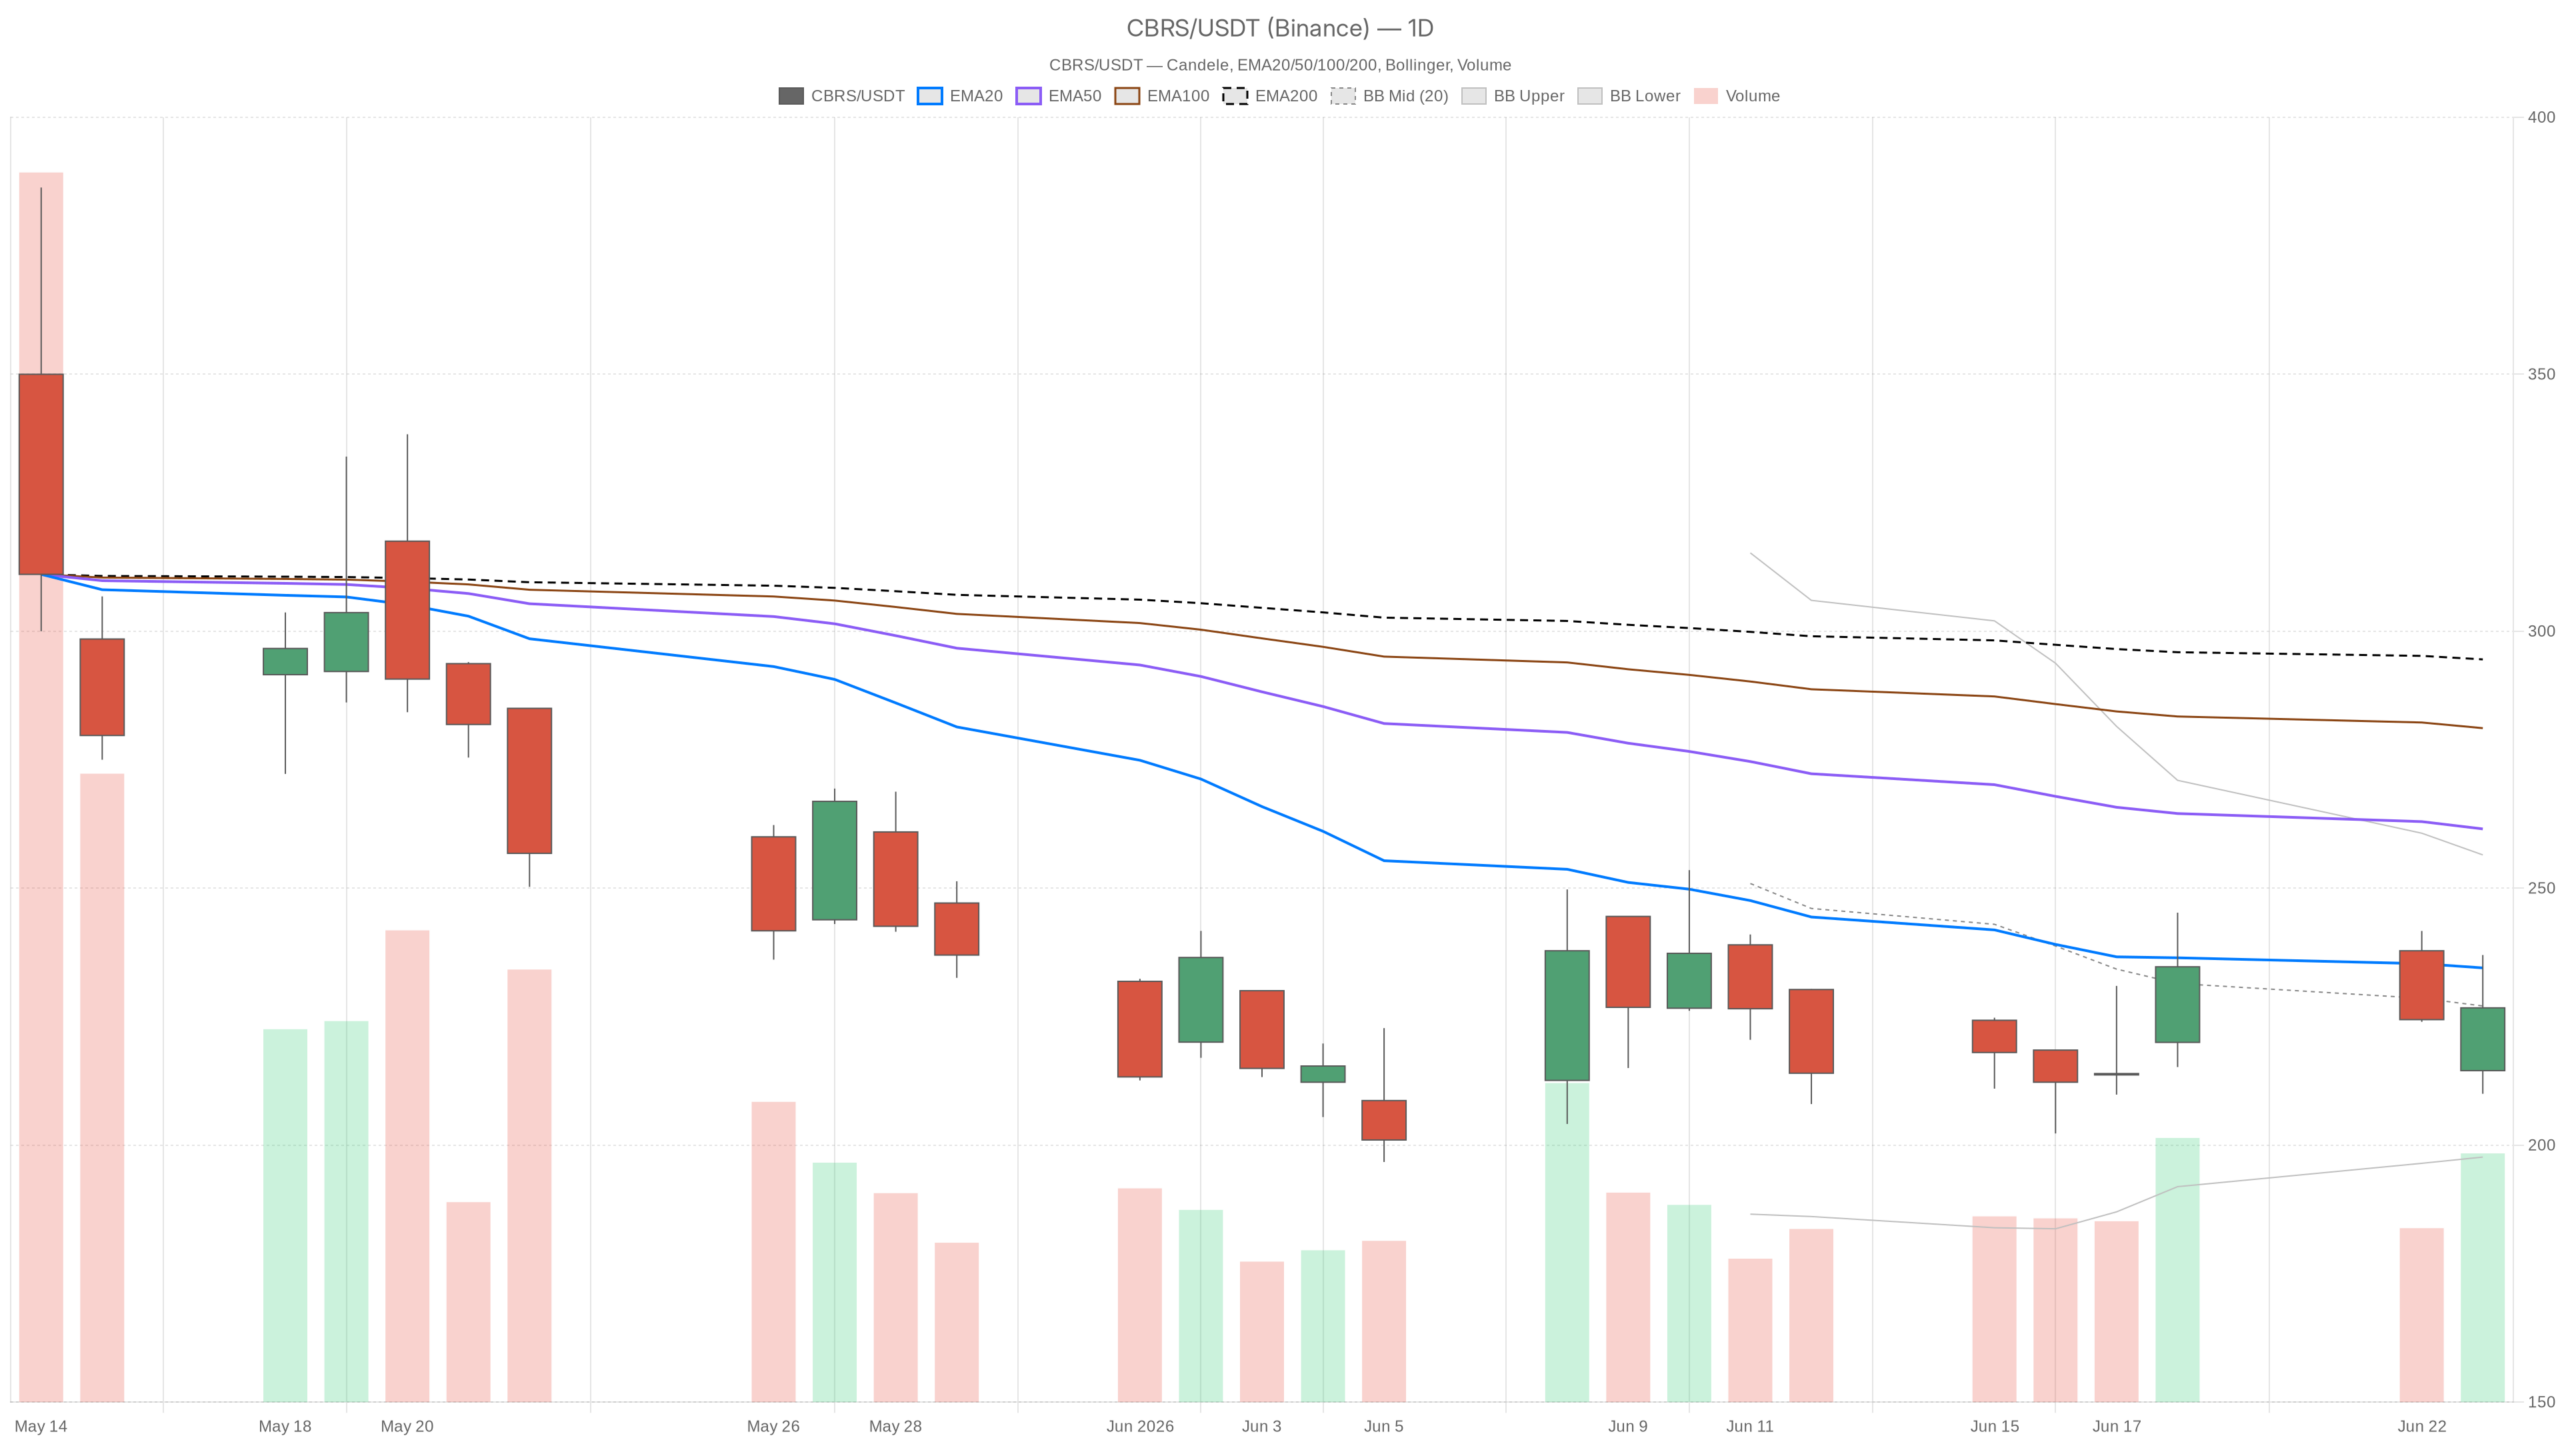 CBRS — daily chart with candlesticks, EMA20/EMA50 and volume.
Key takeaways
- CBRS closed at $226.72, below the 20-day EMA ($234.50) and 50-day EMA ($261.54), confirming a bearish daily regime.
- Daily RSI sits at 41.98, reflecting weak demand but not yet oversold conditions.
- Q1 earnings missed expectations with a $0.22 loss per share, triggering a ~9% after-hours drop.
- A $20 billion OpenAI–AWS partnership provides long-term upside but has not reversed near-term selling pressure.
- Until CBRS reclaims the 20-day EMA with volume, the burden of proof remains with bulls.
Daily Chart: Bearish Regime Remains Intact
Celebras stock is in a confirmed downtrend on the daily timeframe. No current price structure justifies a reversal call.
CBRS closed at $226.72 on June 23. It sits well below the 20-day EMA at $234.50 and the 50-day EMA at $261.54. The 200-day EMA sits even higher at $294.53. Price is trading under all major moving averages simultaneously — a hallmark of sustained distribution pressure.
Meanwhile, the daily RSI at 41.98 is not yet oversold but clearly below the neutral 50 threshold. This reading reflects weak demand rather than panic selling. The daily MACD line at -14.93 remains below the signal line at -18.04. The histogram, however, is recovering slightly at +3.11. That uptick suggests selling pressure may be decelerating. It does not imply a trend reversal.
Bollinger Bands place the midline at $227.08, with CBRS trading just below it at close. The lower band sits at $197.69. If selling resumes, that lower bound becomes the next structural reference. Notably, the daily ATR of $24.25 signals elevated volatility — wide intraday swings are the norm, not the exception.
Overall, pivot analysis places the daily pivot at $224.57, with S1 at $212.15 and R1 at $239.15. CBRS closed above the pivot but remains well below R1. That gap shows how much work bulls need to reclaim short-term overhead resistance.
Momentum Signals Are Not Yet Bullish
The histogram recovery is the only constructive daily signal. However, the MACD line remains deeply negative. The RSI is still below 50. Together, these readings confirm a bearish regime with decelerating downside — not a reversal setup.
Intraday Timeframes: Stabilization, Not Recovery
The hourly and 15-minute charts for Celebras stock show neutral conditions. The downtrend has paused rather than reversed.
On the one-hour chart, price closed at $226.83, sitting marginally above the hourly 20 EMA at $226.75 and 50 EMA at $224.99. This is a slightly constructive short-term reading. However, the hourly 200 EMA at $242.62 remains a heavy ceiling overhead. The hourly RSI at 50.71 sits right at the midpoint, confirming neither bullish nor bearish conviction. The hourly MACD is nearly flat, with the histogram at just +0.02 — offering no directional signal of substance.
The hourly regime is classified as neutral, contrasting sharply with the bearish daily regime. This divergence is important to interpret correctly. The daily trend defines the prevailing pressure. The hourly chart’s neutrality does not cancel that pressure. It simply suggests the immediate downmove has paused.
On the 15-minute chart, the regime is also neutral. All three 15m EMAs are compressed near current price levels, reflecting very little directional momentum. The 15m MACD histogram at +0.46 offers a small positive reading. The 15m ATR of $5.16 reflects manageable intraday noise. However, this timeframe adds little conviction beyond confirming that price has not accelerated lower in the very near term.
Fundamental Crosscurrents
Celebras stock is caught between a disappointing Q1 earnings report and a transformative strategic partnership. The tension in the fundamental narrative remains unresolved.
Notably, Cerebras reported a Q1 loss of $0.22 per share, missing analyst expectations of a $0.16 loss. Gross margin guidance disappointed the market. The stock dropped roughly 9% after hours in response. This reaction is consistent with what the chart was already implying. Institutional appetite for CBRS has been weakening. A negative earnings catalyst simply reinforces the existing downtrend.
In contrast, the OpenAI and AWS partnership announcement is a genuine strategic development. Multi-year deals valued at over $20 billion in AI inference workloads are not routine. For a company of Cerebras’ size, these contracts could be transformative. Yet the market sold the news despite the headline. This reflects legitimate skepticism around margin sustainability, valuation at 100x sales, and customer concentration risk.
Bullish vs. Bearish Scenarios
The bearish scenario for Celebras stock is better supported by current evidence. However, a defined bullish path exists if key levels are reclaimed.
Bullish Scenario
The bullish case requires several conditions to align. First, CBRS must hold above the daily pivot at $224.57 and push cleanly through R1 at $239.15. Reclaiming the 20-day EMA at $234.50 is the minimum requirement for any meaningful shift in daily momentum. Positive margin commentary in subsequent guidance could reignite speculative interest. Evidence that the OpenAI and AWS contracts are translating into near-term revenue acceleration would also help. In that scenario, a retest of the upper Bollinger Band at $256.48 is technically possible.
Bearish Scenario
The bearish case aligns more closely with current evidence. If CBRS fails to hold the $224.57 pivot zone, the next downside reference is S1 at $212.15. Below that, the lower Bollinger Band at $197.69 becomes the key area to watch. Given the daily ATR of $24.25, these levels are reachable within a small number of sessions under continued selling. Any deterioration in margin outlook or further after-hours follow-through would reinforce this path.
FAQ
Is Celebras stock in a downtrend?
Yes. CBRS is trading below all major daily moving averages — the 20-day, 50-day, and 200-day EMAs — which is a hallmark of sustained distribution pressure. The daily RSI at 41.98 further confirms weak demand.
What are the key support levels for CBRS?
The daily pivot at $224.57 is the immediate support. Below that, S1 at $212.15 and the lower Bollinger Band at $197.69 represent the next downside references. The daily ATR of $24.25 suggests these levels are reachable within days if selling continues.
Could the OpenAI–AWS deal reverse the bearish trend?
The partnership is strategically significant, but the market’s negative reaction to Q1 margins suggests investors are prioritizing near-term profitability over long-term contract potential. The deal alone is unlikely to reverse the trend without improving margin dynamics.
What would signal a trend reversal for Celebras stock?
CBRS would need to reclaim the 20-day EMA at $234.50 and push through R1 at $239.15 with volume. A sustained move above the 50-day EMA at $261.54 would provide stronger confirmation, but that remains a distant objective given current price levels.
Disclaimer: This article is for informational purposes only and does not constitute financial advice, an investment recommendation, or a solicitation to buy or sell any financial instrument or cryptocurrency. The analysis provided is not indicative of future results. Investing in crypto assets and financial markets carries a high risk of capital loss. Always do your own research (DYOR) and consult a qualified financial advisor before making any decision.
Article produced with the assistance of artificial intelligence and reviewed by the editorial team.


You May Also Like

SpaceX (SPCX) Stock: Timing Your Entry Around Earnings and Lockup Expiration

Indonesian Rupiah: BI Tightening Expected to Buffer IDR Against US Dollar Strength, Says MUFG

DeFi TVL has been on a steady monthly decline since January


