

Ethereum price targets $1,800 after rare TD buy signal
Ethereum price traded near $1,715 on July 3, according to crypto.news price data, after rising more than 6% over 24 hours.
- Ethereum reclaimed $1,700 as ETF inflows returned, but exchange netflows still warn of selling pressure.
- Monthly TD Sequential signals suggest seller exhaustion, while MACD and RSI show early recovery momentum.
- Binance withdrawal spikes point to accumulation, but rising open interest keeps volatility risk elevated.
The move pushed ETH back above the $1,700 area, a level traders have watched closely after weeks of selling pressure.
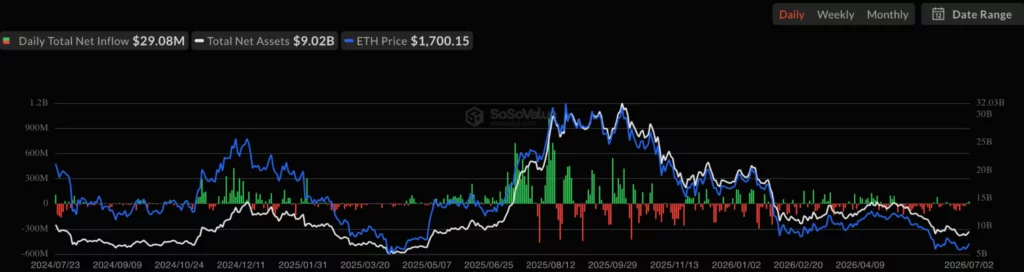
The rebound came as U.S. spot Ethereum ETFs returned to inflows. On July 2, spot Ethereum ETFs recorded total net inflows of $29.08 million, according to SoSoValue data. BlackRock’s ETHA led the group with $29.74 million in net inflows, while Grayscale’s ETHE recorded outflows of $2.75 million.
The token had already been eyeing a $1,700 breakout after July 1 ETF inflows returned. That earlier shift helped ease pressure around the $1,500 support region, but ETH still needed a stronger move above $1,700 to improve its short-term chart.
The next area to watch is $1,800. A clean move above that level could show that buyers are gaining control after the recent drawdown. Failure to hold $1,700 may return focus to $1,650 and then the lower support region near $1,500.
Ethereum Technical indicators improve
Ethereum’s short-term indicators are showing better momentum. The MACD histogram is positive near 19.33, while the MACD line sits around -49.01 and above the signal line near -68.34. That confirms the recent bullish crossover has gained strength.
The broader signal is not fully bullish yet because both MACD lines remain below the zero line. This means downside pressure has eased, but the token has not confirmed a full trend reversal. Traders usually look for MACD follow-through toward the zero line before calling a stronger recovery.
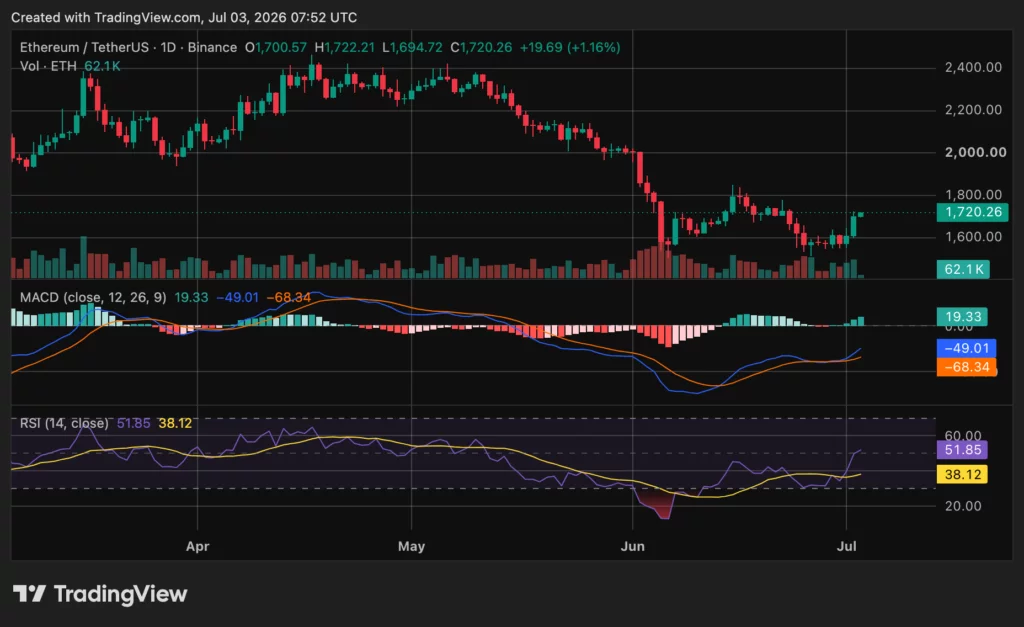
The RSI also improved. It stood near 51.85, above its moving average near 38.12. This move above 50 shows buyers are starting to regain control after a weak June.
Crypto analyst Ali Charts said the token has printed a monthly TD Sequential buy signal. In his view, the signal suggests seller exhaustion on a higher timeframe. He also said ETH is approaching a long-term support area near $1,100, which he described as the bottom boundary of Ethereum’s multi-year channel.
Ali Charts pointed to $3,000 as a mid-range recovery target if that lower channel holds. He also placed the broader channel ceiling near $5,000. Those levels are long-term technical targets, not short-term price calls.
ETH/BTC setup draws attention
Ethereum’s performance against Bitcoin is also drawing attention. Crypto Rover said an ETH/BTC golden cross is forming, with the 50-week moving average moving toward a cross above the 100-week moving average. He said the last similar signal in 2021 came before ETH outperformed Bitcoin.
That setup matters because ETH has lagged Bitcoin during the broader market decline. A stronger ETH/BTC pair would show that capital is rotating back toward Ethereum rather than only following Bitcoin’s rebound.
Derivatives data also shows rising activity. According to Coinglass data, ETH volume rose 14.48% to $44.74 billion, while open interest increased 10.64% to $24.54 billion. Options volume climbed 30.19% to $1.41 billion, and options open interest rose 6.67% to $4.43 billion.
Rising open interest can support stronger price moves when buyers lead the market. It can also raise liquidation risk if leveraged positions build too quickly. For that reason, the current derivatives setup points to more volatility rather than a clean bullish trend.
On-chain signals remain mixed
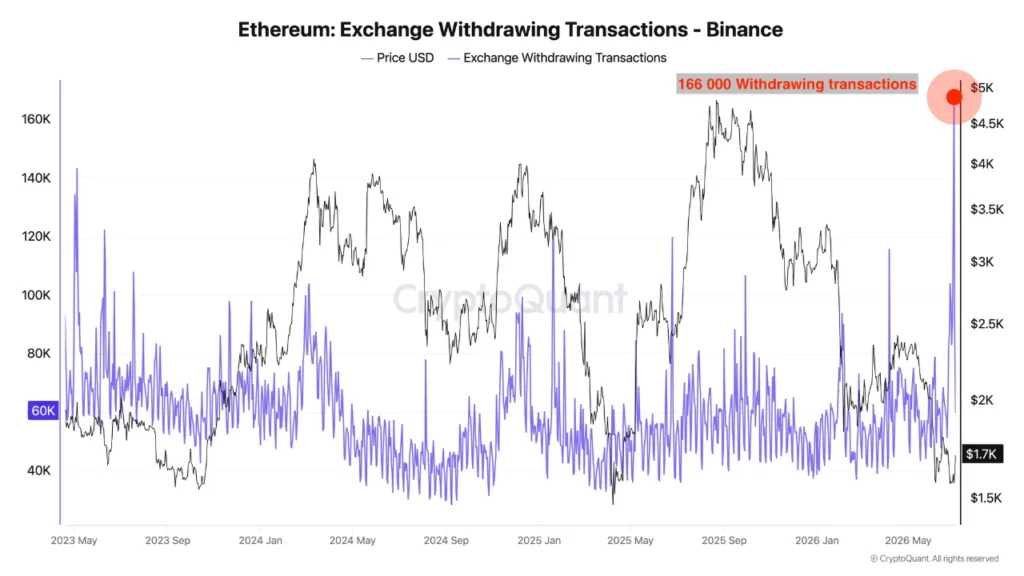
CryptoQuant analyst Darkfost said Binance ETH withdrawal transactions hit their highest level in three years. Binance reportedly logged more than 166,000 withdrawal transactions in one day as ETH rebounded from the $1,500 area.
Exchange withdrawals can point to accumulation when users move coins into self-custody. They can also show funds moving into DeFi for yield. Darkfost said some withdrawals may also reflect confusion around MiCA rules that took effect on July 1, even though withdrawals were not frozen.
Another CryptoQuant analyst, PelinayPA, gave a more cautious reading. The analyst said Binance ETH exchange netflow remained positive at +12,938 ETH, meaning more ETH was moving into the exchange than leaving it. Positive netflow can create selling risk because coins on exchanges are easier to sell.
That contrast keeps the short-term outlook balanced. Withdrawal transactions suggest some users may be accumulating. Positive netflow and rising open interest suggest selling pressure and leverage have not disappeared.
Institutional activity adds support
Ethereum also has support from corporate and institutional activity. As crypto.news reported, Ethereum Institutional launched with backing from BitMine, SharpLink, Joe Lubin, and other contributors to support adoption by banks, asset managers, custodians, and financial firms.
BitMine has continued building its Ethereum treasury. As previously reported, BitMine added 27,084 ETH, lifting its holdings to more than 5.7 million ETH, or about 4.7% of Ethereum’s supply.
SharpLink has also kept buying during weakness. The company bought another 10,000 ETH for $16.1 million as Ethereum tested lower support.
Disclosure: This article does not represent investment advice. The content and materials featured on this page are for educational purposes only.


You May Also Like

Alleged Huione Money Laundering Boss Extradited to China
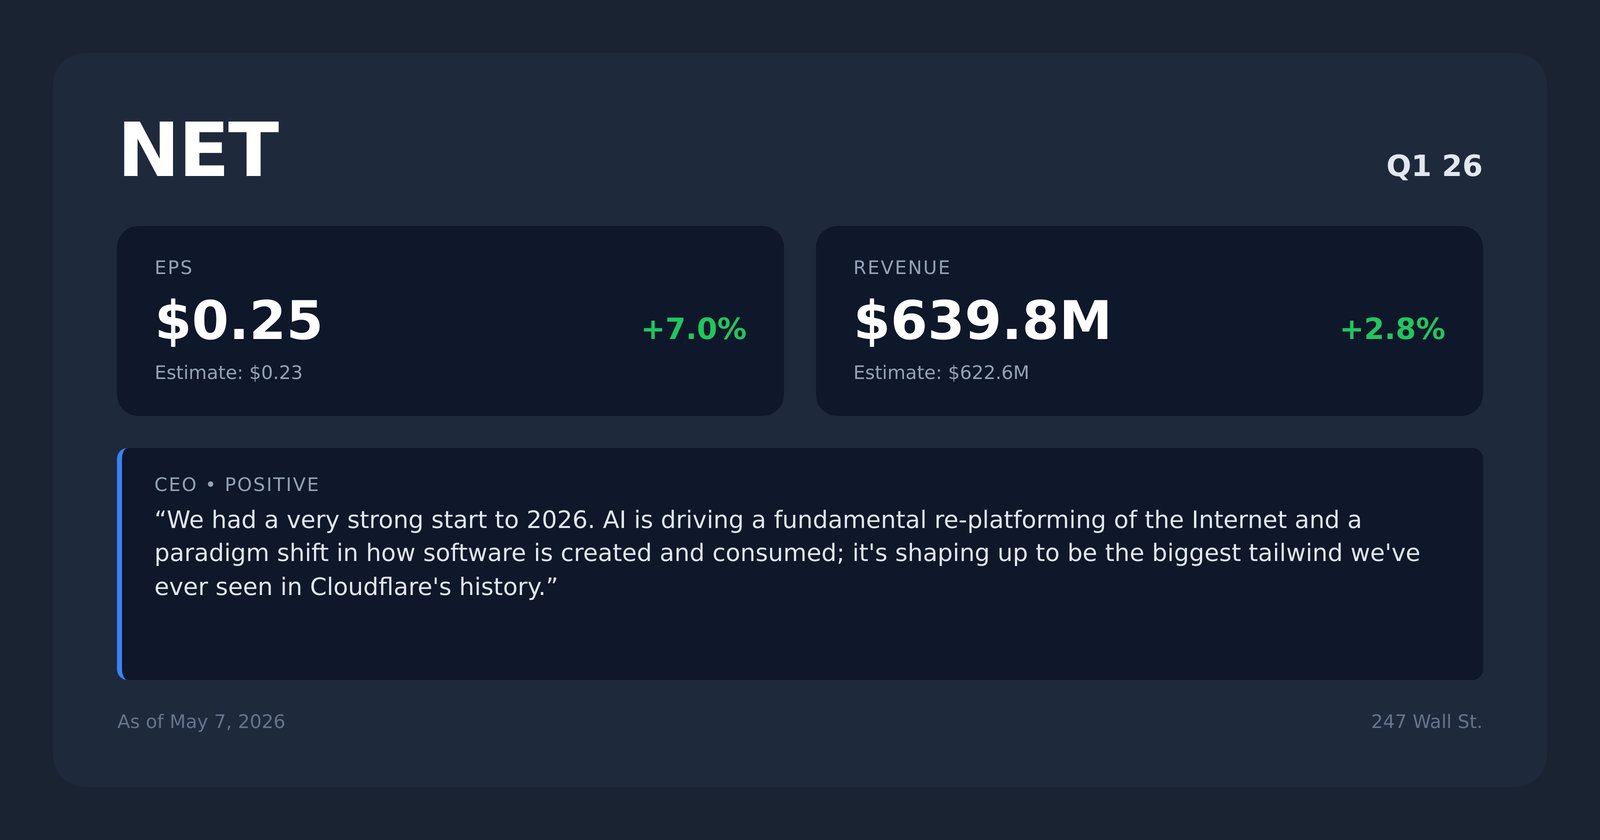
How Cloudflare Is Positioning for the AI Era


