

Dogecoin Just Flashed a Rare Buy Signal: Top Analyst Says DOGE Price Could Go Wild Next
Dogecoin has spent the last 3 days moving higher, and the latest technical signal has given bulls another reason to watch the chart closely. Crypto analyst Ali Charts believes something much bigger could be developing after a rare TD Sequential buy signal appeared. That type of signal often appears near important turning points, although price action still needs to confirm that a larger rally is underway.
Recent gains have already pushed DOGE above an important price level. Short-term indicators continue pointing upward, although a major resistance zone still stands between Dogecoin and a stronger breakout. That creates an interesting setup because the lower timeframes look bullish, but the bigger picture still needs more confirmation.
Dogecoin Price Breaks Above Key Support as Short-Term Indicators Stay Bullish
Ali Charts recently posted that Dogecoin had printed a TD Sequential buy signal and added that things could “go wild.” That comment points to the possibility of a much larger bullish move if buyers continue taking control over the coming sessions.
The current DOGE price structure supports a positive outlook in the short term. Dogecoin has now recorded 3 consecutive green daily candles and has broken above the important $0.076 level. That former resistance could now act as support if buyers successfully defend it.
The next target sits around $0.082. Success above that level would expose the next resistance near $0.09. Buyers would then have the psychological $0.10 level firmly in view.
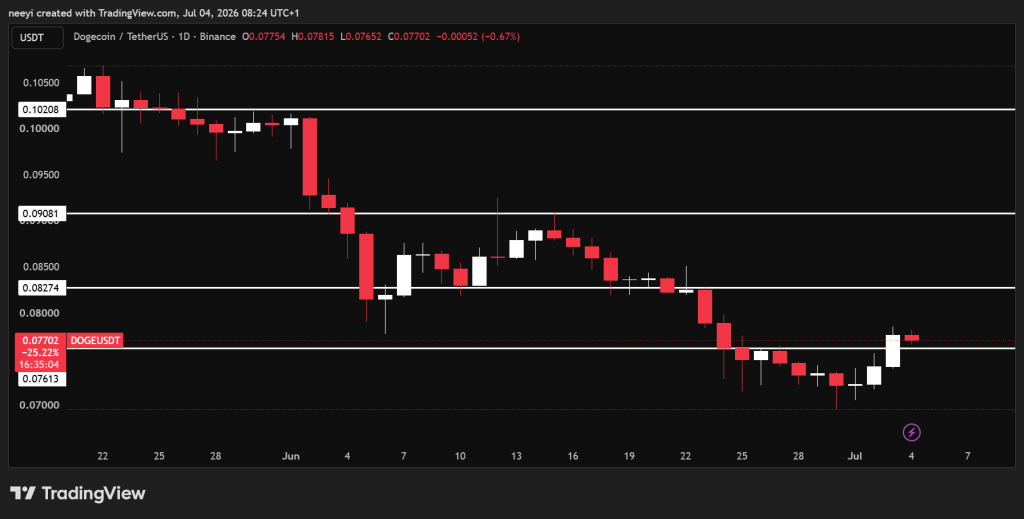 DOGE Price Chart / TradingView.com
A look at the 5 hour Dogecoin chart shows technical indicators lining up on the bullish side.
The Relative Strength Index currently stands at 60.752. That reading shows buying pressure remains healthy without entering overbought territory.
The Stochastic indicator prints 71.601. Buyers continue controlling short term momentum, although the indicator has started moving closer to overbought levels.
MACD produces a Buy signal with a value of 0.001. Positive momentum therefore remains active.
ADX reads 51.566. That level points to a strong trend and confirms that the current move has strength behind it.
The Ultimate Oscillator comes in at 58.723. That reading supports the bullish outlook because buying pressure continues outweighing selling pressure.
| Name | Value | Action |
|---|---|---|
| RSI (14) | 60.752 | Buy |
| STOCH (9,6) | 71.601 | Buy |
| MACD (12,26) | 0.001 | Buy |
| ADX (14) | 51.566 | Buy |
| Ultimate Oscillator | 58.723 | Buy |
Weekly Dogecoin Chart Shows More Confirmation Is Still Needed
Ali Charts believes Dogecoin could “go wild,” which points to expectations for a much larger bullish move than the current recovery. Current short term signals certainly support that possibility. Even so, the weekly chart still tells a more cautious story.
Several longer term indicators continue flashing Sell signals. That means DOGE price may need additional buying pressure before a sustained rally becomes more likely.
The weekly RSI stands at 34.566. That level remains weak and shows buyers have not fully regained control of the broader trend.
The Stochastic indicator reads 30.012. Momentum remains soft despite the recent recovery.
MACD still produces a Sell signal with a value of negative 0.019. Bullish momentum has therefore not returned on the weekly timeframe.
ADX measures 28.093. That reading points to a relatively weak trend compared with the stronger readings seen on the lower timeframe.
The Ultimate Oscillator comes in at 38.396. Selling pressure still outweighs buying activity on the weekly chart.
| Name | Value | Action |
|---|---|---|
| RSI (14) | 34.566 | Sell |
| STOCH (9,6) | 30.012 | Sell |
| MACD (12,26) | -0.019 | Sell |
| ADX (14) | 28.093 | Sell |
| Ultimate Oscillator | 38.396 | Sell |
Price action also points to another important challenge ahead. The $0.09 resistance has acted as a very important technical level throughout Dogecoin’s history. That area served as support for almost 2 years before DOGE price finally broke below it. Former support often becomes strong resistance after breakdowns, and the chart appears to be following that pattern once again.
That means the move from $0.082 toward $0.09 may happen without too much difficulty if buying continues. Breaking above $0.09 could prove much harder because sellers may become much more active around that area. Stronger bullish momentum would likely be needed before DOGE price can clear that barrier and begin pushing toward $0.10.
Read Also: Bitcoin Price Just Flashed 3 Signals Bulls Have Been Waiting For!
Short term technical signals currently favor the bulls, and Ali Charts’ TD Sequential signal adds another positive factor to watch. Even so, the weekly chart still calls for patience because stronger confirmation has not arrived yet.
FAQs
Subscribe to our YouTube channel for daily crypto updates, market insights, and expert analysis.
The post Dogecoin Just Flashed a Rare Buy Signal: Top Analyst Says DOGE Price Could Go Wild Next appeared first on CaptainAltcoin.


You May Also Like
Ethereum Price Prediction Turns Bullish as ETH Clears $1,700

Brazil vs Norway Head-to-Head: Why the Norway Hoodoo Matters at World Cup 2026

Iran’s foreign minister targeted in assassination attempt, wife killed


