

SUI Price Builds Bullish Setup as Analysts Eye $1.40 Recovery
Key Insights:
- SUI price trades around $0.76 after rebounding from a key support zone.
- Michaël van de Poppe sees a potential rally toward $1.10 or $1.40.
- Higher-timeframe analysis points to a possible 200% move if support holds.
SUI price is showing early recovery signs after weeks of selling pressure pushed the token toward a major support area. The price most recently came close to $0.76 in a recent attempt to hold the bottom end after a significant pullback from prior tops.
Now, several analysts are focusing on strengthening the momentum on the various time frames. All the daily divergence, the short-term scale compression, and the higher time frame support indicate that SUI might be on the verge of an important breakout test. However, SUI crypto still needs confirmation before larger targets become realistic.
SUI Price Shows Bullish Divergence
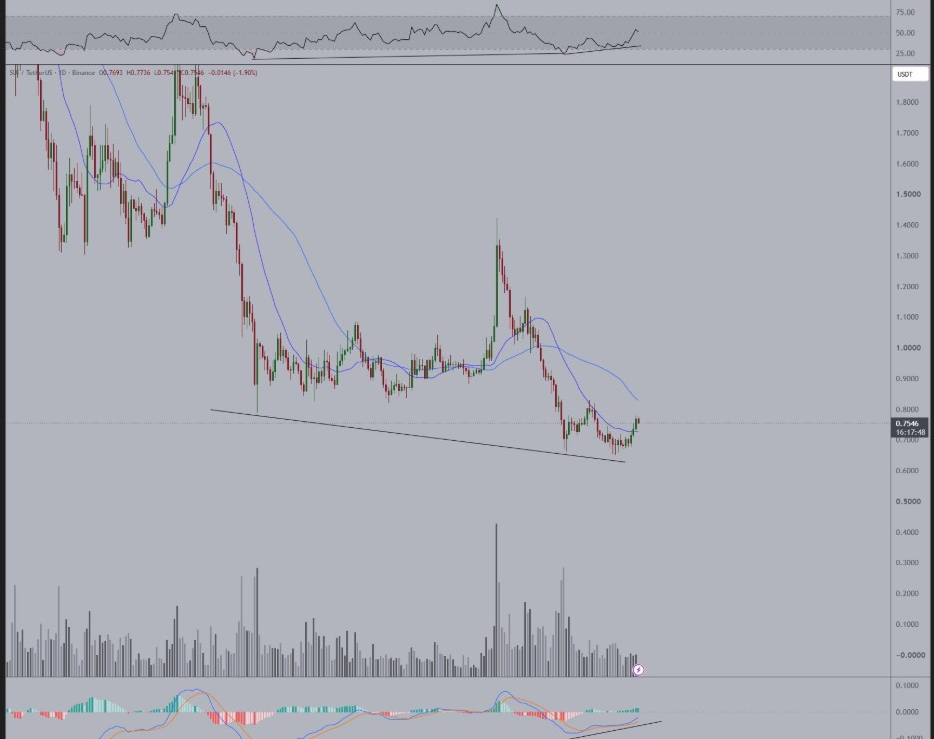
SUI price is trading near $0.76 after bouncing from a lower support area around $0.65 to $0.70. The daily chart shared by Michaël van de Poppe showed price forming lower lows while momentum indicators began moving higher.
 SUI Price Chart | Source: Micheal Van de Poppe, X
This divergence often signals that selling pressure is weakening. It does not confirm an immediate rally, but it shows that the downtrend may be losing strength after months of pressure.
Van de Poppe said the setup could support a move toward $1.10 or $1.40 if momentum continues improving. His chart also showed Sui price attempting to reclaim short-term moving averages after spending several weeks below them.
The first important resistance sits near $0.80. A daily close above that area could strengthen the recovery attempt and bring the $0.90 to $1 range back into focus.
If SUI loses the $0.65 support area, the bullish divergence would weaken. That would expose the token to another downside move before buyers attempt a fresh recovery.
SUI Crypto Triangle Setup Signals Compression
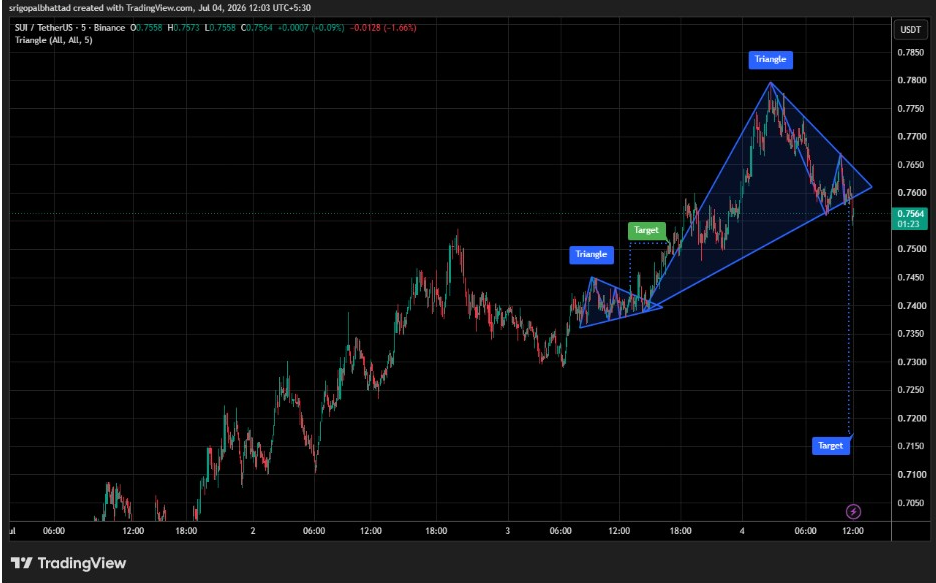
Meanwhile, shorter-term charts revealed that after the recent bounce, SUI price has picked up a symmetrical triangle setup. The chart’s trend began as price formed higher bottoms and lower tops, providing the trend pause following a strong intraday price move.
 SUIUSDT Price Chart | Source: Gopal, X
Crypto With Gopal said this structure reflects consolidation as buyers continue defending support. The chart places SUI price near $0.756, close to the middle of the triangle range.
A breakout above the upper trendline could trigger another leg higher. The first short-term upside area sits near $0.78, followed by the wider resistance band around $0.80.
However, the triangle also carries downside risk. A break below the lower boundary could send price toward the $0.715 region shown on the chart.
For now, the pattern shows that SUI is preparing for a larger move. Direction will depend on whether buyers can reclaim the upper trendline with stronger volume.
SUI Crypto Support Holds the Reversal Structure
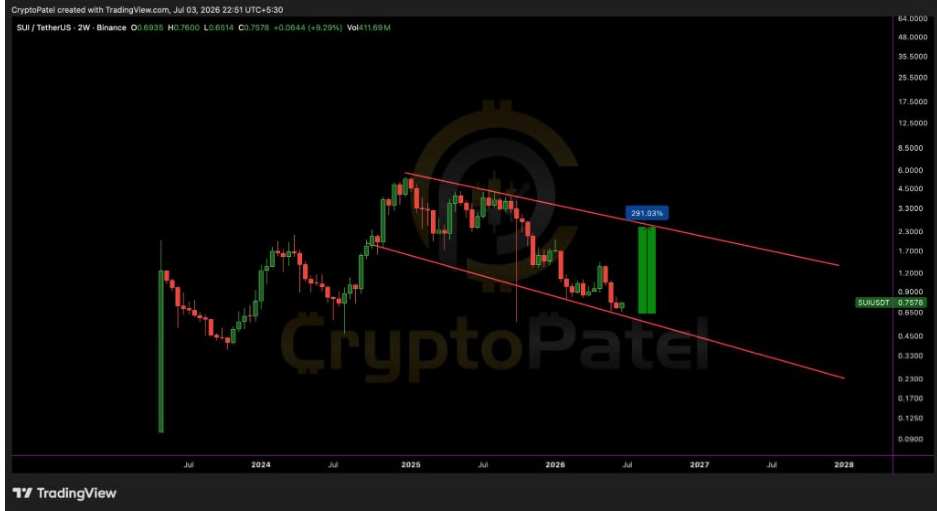
Additionally, Crypto Patel highlighted a higher-timeframe descending channel, with SUI testing the lower part of that structure. The chart shows price holding near the same support region that has limited deeper losses in recent weeks.
 SUIUSDT 2W Chart | Source: Crypto Patel, X
According to the analysis, holding this trendline could open the door for a powerful reversal. The chart projects a potential 291% move if Sui price rebounds from the current area and moves toward the upper channel boundary.
That projection places the first major higher-timeframe target near $2.30. However, SUI price must first clear several resistance levels before that move becomes realistic.
The nearest levels remain $0.80, $0.90, and $1.10. A move above $1.40 would provide stronger evidence that buyers have regained control of the broader structure.
If the lower channel support fails, the reversal setup would lose strength. The next phase would likely depend on whether buyers can defend the $0.60 region.
Breakout Targets Depend on Confirmation
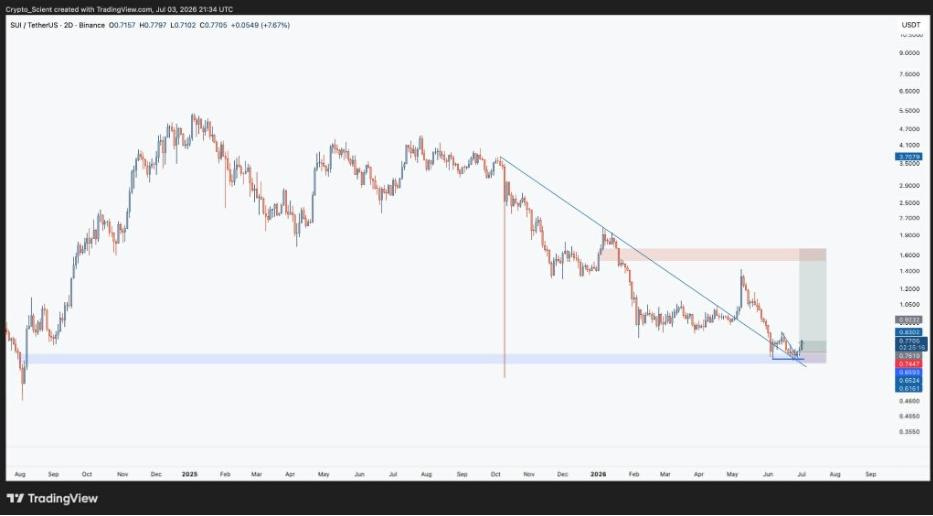
Notably, Crypto Scient also sees SUI pressing against a short-term breakout area after rebounding from support. His chart showed price moving out of a falling structure while holding above a demand zone between roughly $0.65 and $0.70.
 SUIUSDT 2D Chart | Source: Crypto Scient, X
The analysis marks nearby resistance around $0.83 and $0.92. Those levels align with other charts showing that SUI price must reclaim the $0.80 to $1 region before a larger move can develop.
A confirmed move above $0.92 would strengthen the path toward $1.10. If momentum continues, the next major target sits near $1.40, matching van de Poppe’s projection. The broader bullish case depends on three steps. SUI must hold above $0.65, break above $0.80, and then reclaim $1 with volume confirmation.
The post SUI Price Builds Bullish Setup as Analysts Eye $1.40 Recovery appeared first on The Market Periodical.


You May Also Like
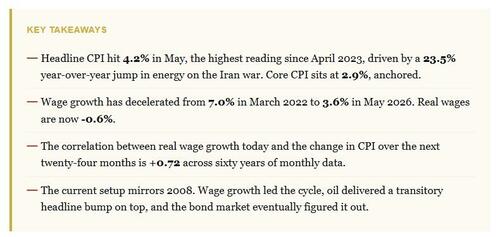
Wage Growth As A Leading Inflation Indicator

USA vs Belgium Odds: World Cup 2026 Win Probability and MEXC Prediction Market Guide
Why Michael Burry’s Massive Bet Against Micron Could Be His Biggest Mistake Yet


