

SpaceX Stock Hits All-Time Low as Morgan Stanley Sets $300 Target

SpaceX stock is navigating a critical moment. SPCX closed at $148.30 on July 8, sitting below its IPO opening price and facing a technically fragile structure. The stock has lost early momentum and is now being repriced through a more sober lens.
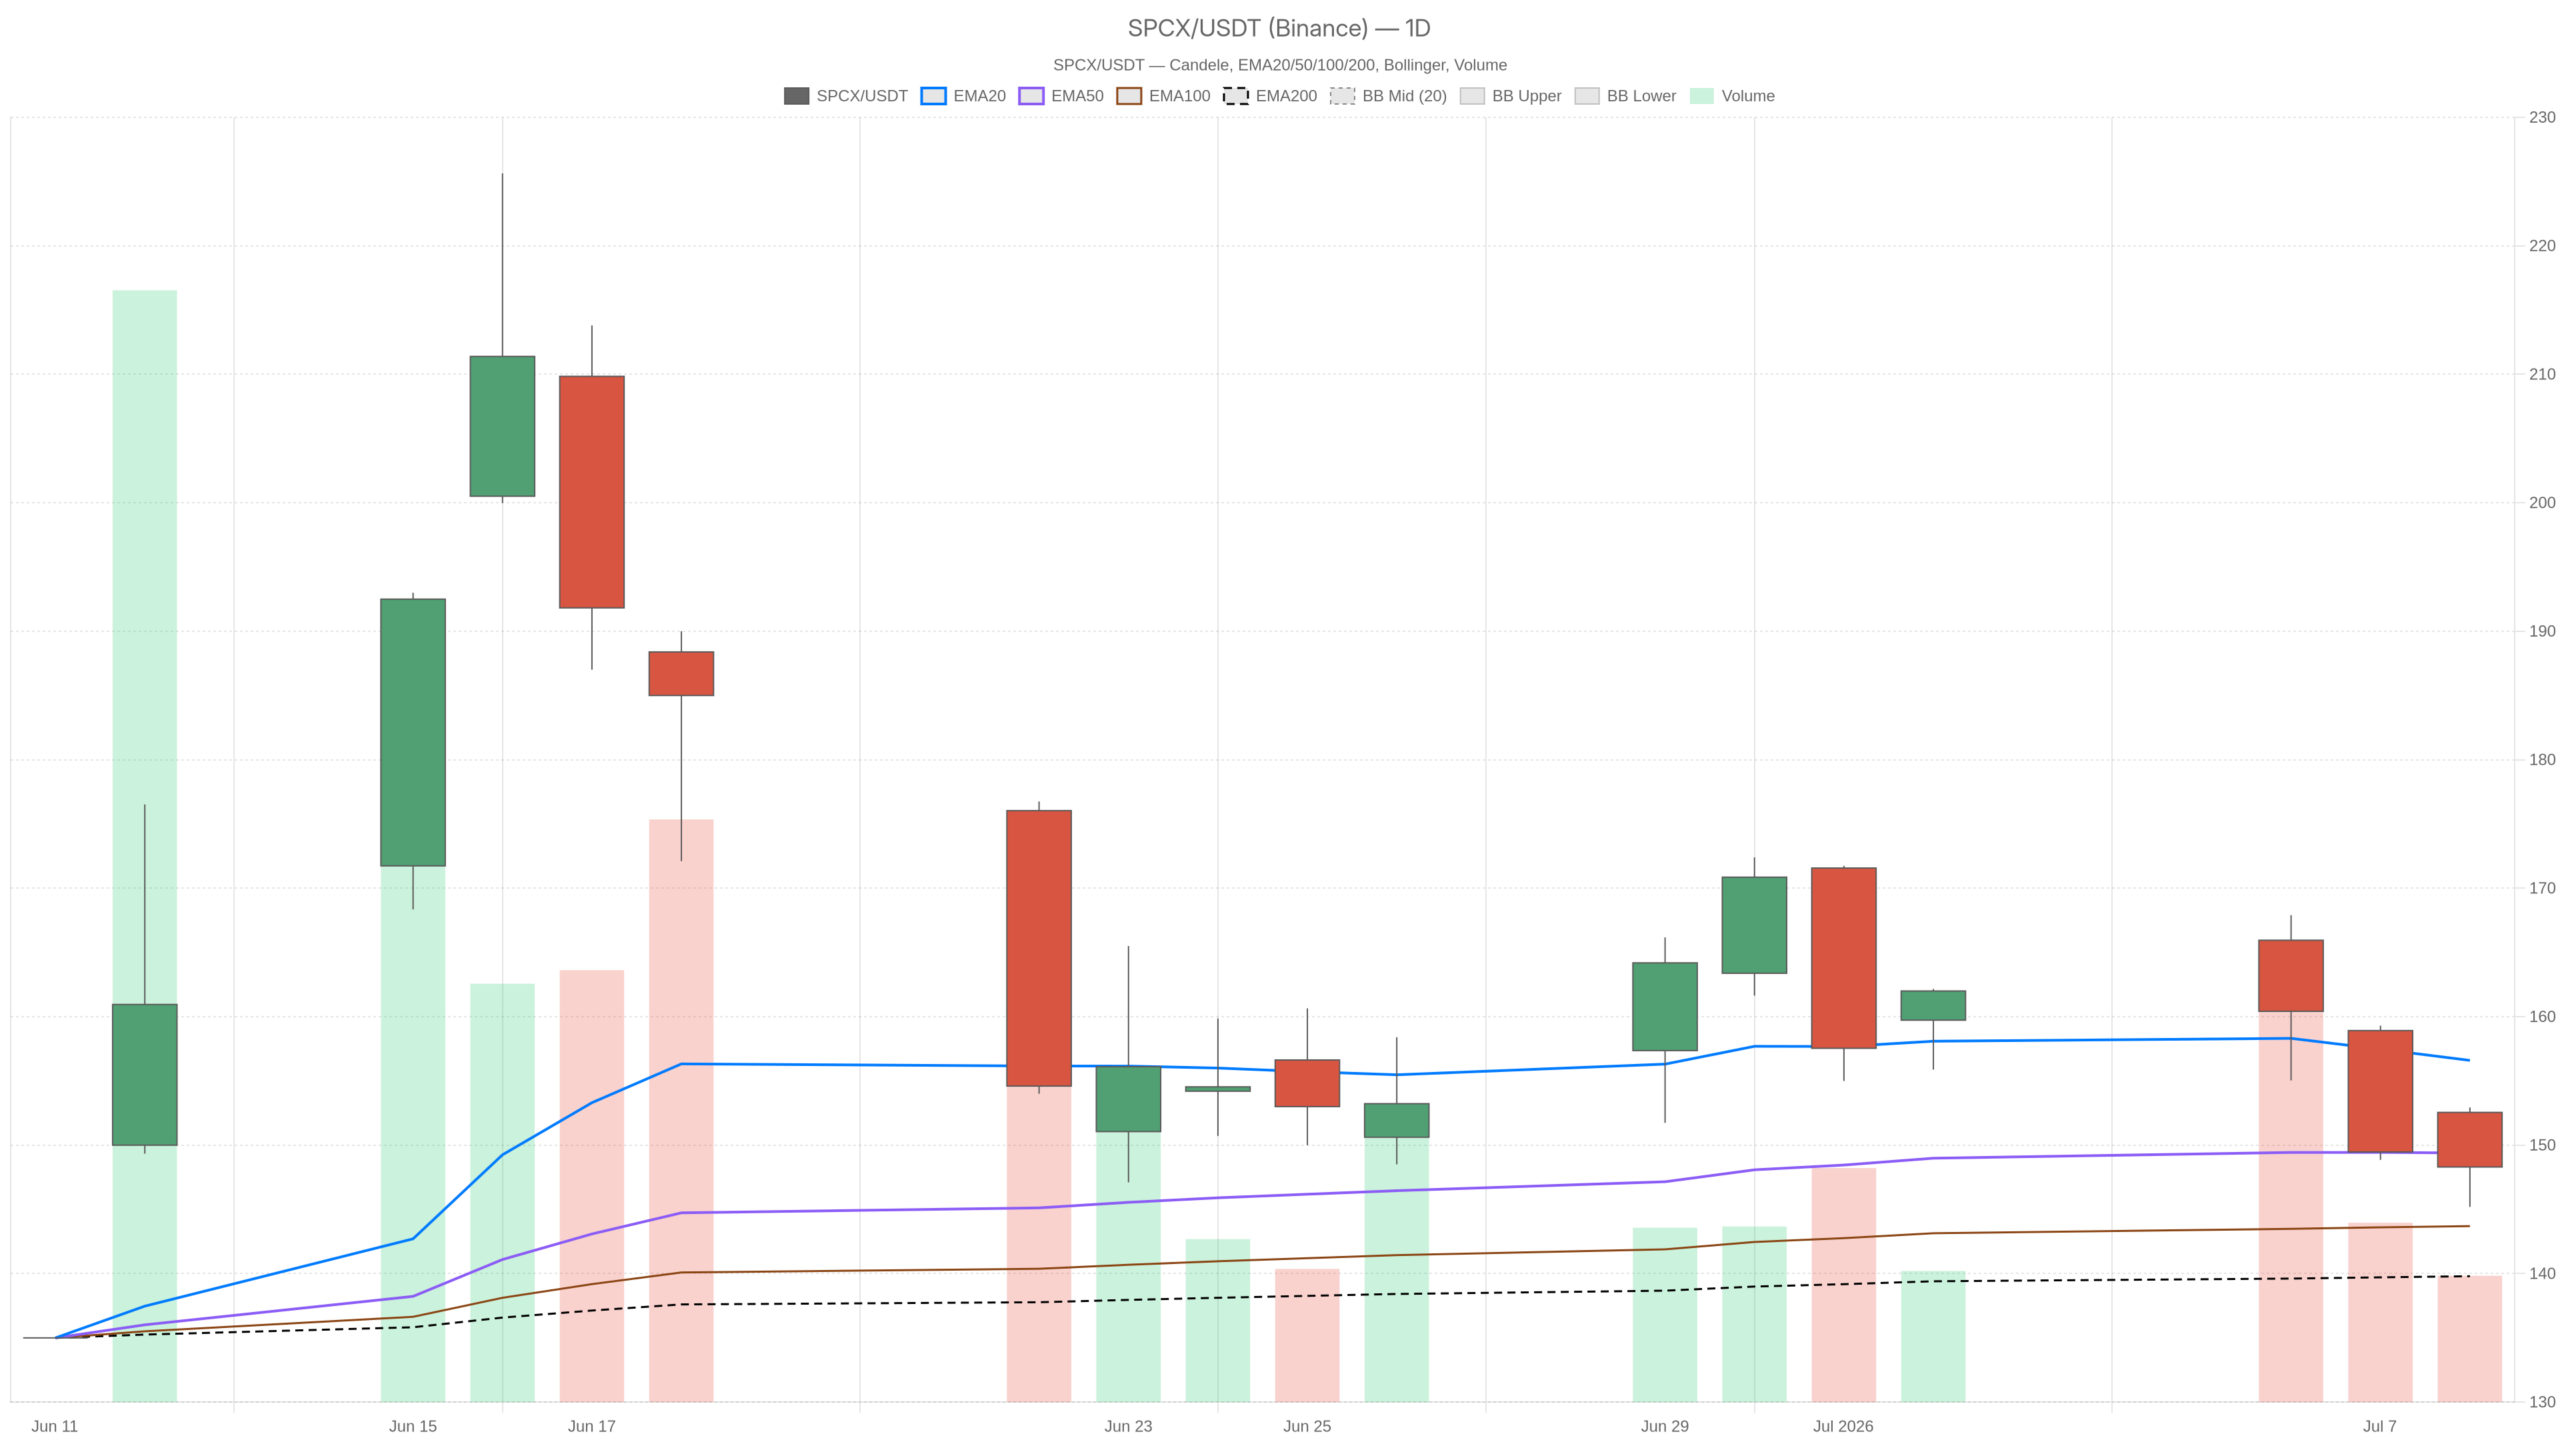 SPCX — daily chart with candlesticks, EMA20/EMA50 and volume.
Key takeaways
- SPCX closed at $148.30 on July 8, below its IPO opening price.
- Morgan Stanley initiated coverage with an Overweight rating and a $300 price target.
- The 1H chart shows a bearish regime with price below all key exponential moving averages.
- Daily ATR14 at $14.71 signals elevated volatility and wide intraday swings.
- The stock dropped 7% despite a wave of bullish analyst initiations.
Daily Bias: Neutral With a Bearish Undertow
SPCX maintains a neutral daily bias, but bearish pressure is clearly building beneath the surface. The daily chart shows price at $148.30, well below its EMA20 at $156.60. The EMA50 sits at $149.39 — price is wrestling with this level after closing just beneath it. Meanwhile, the EMA200 at $139.80 remains a distant backstop with little near-term comfort.
The daily MACD tells a more cautious story. The MACD line stands at 2.58, above zero, but the signal line at 5.22 has pulled ahead decisively. The histogram at -2.64 confirms momentum is fading, even if the broader trend hasn’t fully rolled over. RSI14 at 53.77 sits in neutral territory — neither oversold nor showing upside conviction. Overall, the daily picture is one of deteriorating momentum inside a still-constructive range.
Volatility and Pivot Levels Frame the Risk
Daily ATR14 at $14.71 deserves attention. That wide true range reflects real volatility beneath the surface. Short-term price swings of several dollars in either direction are well within normal parameters right now.
The daily pivot sits at $148.81, almost exactly where SPCX closed. Resistance at R1 ($152.42) aligns closely with the session high of $152.93. This suggests the market already tested and rejected that level intraday. Support at S1 stands at $144.69 — the next meaningful downside reference if selling resumes.
SpaceX Stock on the 1H: Bearish Regime Complicates the Picture
The 1H chart for SpaceX stock is explicitly bearish, with price trading below all key moving averages. The 1H EMA structure is fully stacked against the bulls. Price at $148.36 sits below the EMA20 ($151.84), the EMA50 ($156.27), and the EMA200 ($163.41). This triple alignment of declining EMAs above price indicates the dominant intraday trend is firmly to the downside.
The 1H RSI at 38.88 is approaching oversold territory without reaching it. That combination — trending lower without a full washout — often precedes another leg down rather than an immediate bounce. However, the hourly MACD adds nuance: the line is at -3.22, below the signal at -2.83, with the histogram at -0.39. The histogram is narrowing slightly, hinting at a marginal deceleration in selling pressure. Still, this is not a reversal signal in isolation.
Bollinger Bands Define the Short-Term Boundaries
Bollinger Bands on the 1H frame the range clearly. The midband at $152.72 acts as short-term resistance. Price is hovering between the midband and the lower band at $143.20. A close toward $143 would indicate genuine deterioration. In contrast, reclaiming the $152.72 midband would be the first credible sign of hourly stabilization.
15-Minute Context: A Tactical Bounce, Not a Reversal
The 15-minute chart shows a tactical bounce from the session low, but no structural reversal is in play. The 15-minute timeframe registers a neutral regime as of the July 8 close. Price recovered from the session low of $145.26 to close at $148.36 — a meaningful intraday bounce. The 15m MACD histogram turned marginally positive at 0.09, and RSI at 50.64 is back to the midpoint. These are short-term stabilization signs, not structural repairs.
The 15m Bollinger midband at $147.67 has been reclaimed. The upper band at $150.91 aligns with the $150.49 R1 pivot — a tight confluence of resistance. Any attempt to push through $150–$150.91 without volume support would likely stall.
The Fundamental Backdrop: Analyst Optimism Meets Market Skepticism
The fundamental backdrop for SpaceX stock reveals a sharp disconnect between analyst enthusiasm and actual market behavior. Morgan Stanley initiated SPCX with an Overweight rating and a Street-high price target of $300. A flood of analyst initiations hit roughly 16 trading days after SpaceX’s Nasdaq debut. Yet the stock dropped 7% and broke below its IPO opening price. This reveals a striking disconnect between sell-side optimism and how the market is actually pricing the shares.
Meanwhile, SpaceX submitted an FCC application to launch 100,000 Generation 3 Starlink satellites. That is an enormous operational ambition, and it adds long-term growth credibility. At the same time, rival Blue Origin is actively seeking new funding. This positions SPCX within a competitive landscape the market is still learning to price. Notably, SPCX hit an all-time low and dipped below its IPO opening price. This confirms the post-honeymoon phase has arrived. Early narrative enthusiasm is giving way to real price discovery.
Bullish Scenario: What Would Support a Recovery
A credible bullish recovery for SpaceX stock requires reclaiming the daily EMA50 at $149.39. Above that level, the $152.42 daily R1 and the $151.84 hourly EMA20 form the next cluster of resistance. A sustained close above $152–$153 would signal buyers are regaining structural control.
On the fundamental side, positive catalysts could shift the picture. News around Starlink satellite approvals, strong revenue disclosures, or a broader technology sector rally might provide the spark that valuation alone has failed to deliver. The $300 Morgan Stanley target reminds the market that long-term believers see substantial upside. However, the bridge from current prices to that target requires confidence to return.
Bearish Scenario: What Would Invalidate the Bull Case
The bull case for SPCX would be invalidated by a failure to hold daily S1 support at $144.69. A break below that level would be a bearish development of consequence. The next technical reference is the daily EMA200 at $139.80. Since SPCX has already breached its IPO opening price, sentiment-driven selling could accelerate if the psychological break deepens.
The 1H bearish regime compounds the risk. Price trading below all key hourly EMAs means the path of least resistance remains to the downside until proven otherwise. Continued underperformance relative to a bullish analyst consensus would only deepen market skepticism.
Positioning and Volatility Outlook
SPCX presents a genuinely mixed picture, with daily neutrality masking clear hourly bearish momentum. The daily structure remains nominally neutral, but hourly momentum is clearly bearish. The stock has already absorbed a damaging symbolic break below its IPO price. Daily ATR near $15 means volatility is elevated, and positioning carries meaningful two-way risk.
The gap between Wall Street’s $300 target and a stock printing all-time lows is the central tension traders must navigate. Until SPCX reclaims the EMA50 on the daily chart and neutralizes the hourly bearish regime, the burden of proof lies firmly with the bulls.
FAQ
What is the current price of SpaceX stock (SPCX)?
SPCX closed at $148.30 on July 8, sitting below its IPO opening price and below the daily EMA20 of $156.60.
What is Morgan Stanley’s price target for SPCX?
Morgan Stanley initiated coverage with an Overweight rating and a Street-high price target of $300, the most bullish target among analyst initiations covering the stock.
Is SPCX in a bearish or bullish trend?
The daily chart shows a neutral regime, but the 1H chart is explicitly bearish with price below the EMA20, EMA50, and EMA200. The short-term trend favors further downside until key resistance levels are reclaimed.
What are the key support and resistance levels for SpaceX stock?
Key support sits at $144.69 (daily S1) and $139.80 (daily EMA200). Key resistance is at $149.39 (daily EMA50), $152.42 (daily R1), and $152.72 (1H Bollinger midband).
Disclaimer: This article is for informational purposes only and does not constitute financial advice, an investment recommendation, or a solicitation to buy or sell any financial instrument or cryptocurrency. The analysis provided is not indicative of future results. Investing in crypto assets and financial markets carries a high risk of capital loss. Always do your own research (DYOR) and consult a qualified financial advisor before making any decision.
Article produced with the assistance of artificial intelligence and reviewed by the editorial team.


You May Also Like

Cash Cat Explodes, Then Crashes: What Happened?

PHL signs P124B in Canada energy, critical-mineral investment pledges

StakeStone (STO) Rockets 125%: What $981M Trading Volume Reveals



